@covid19cl
1/5
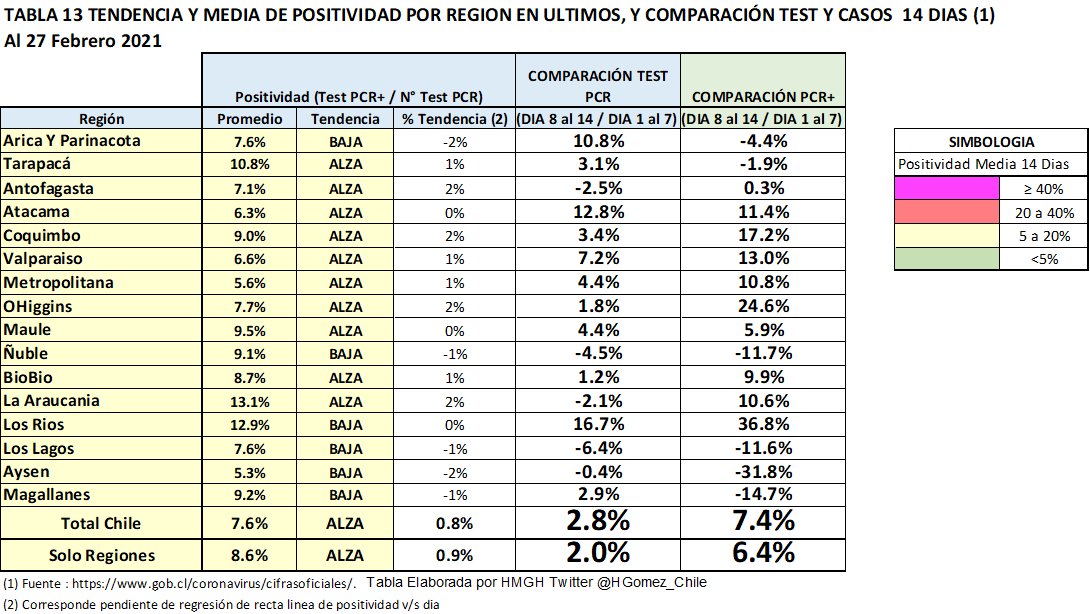
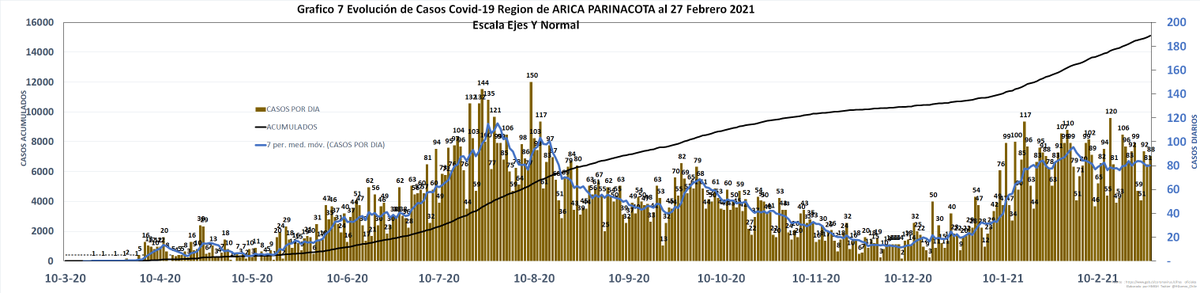
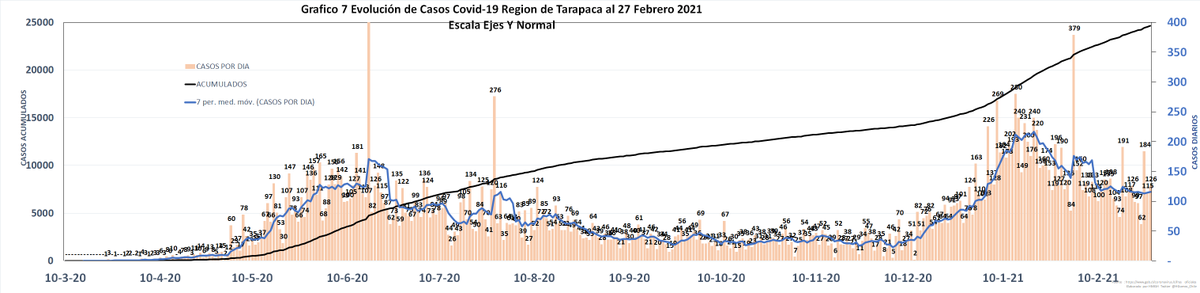
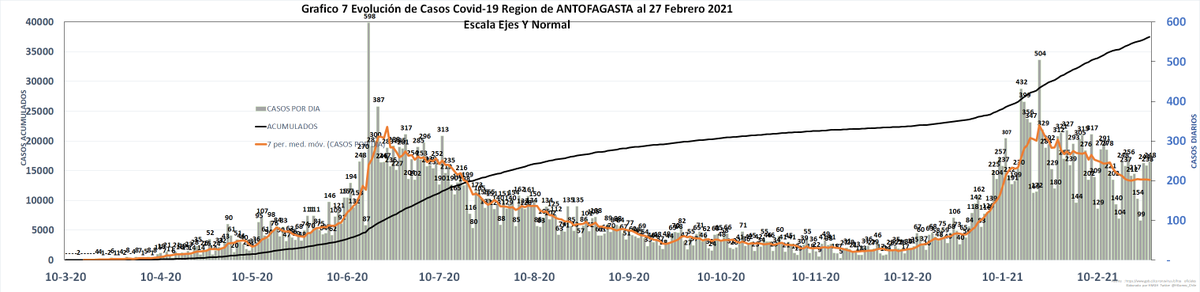
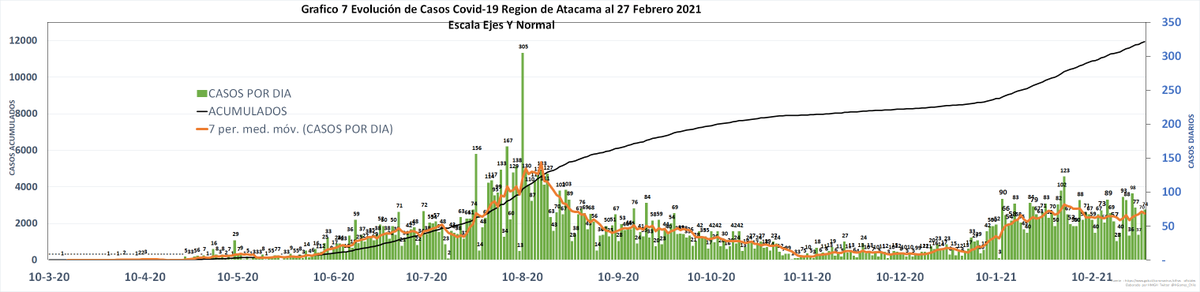
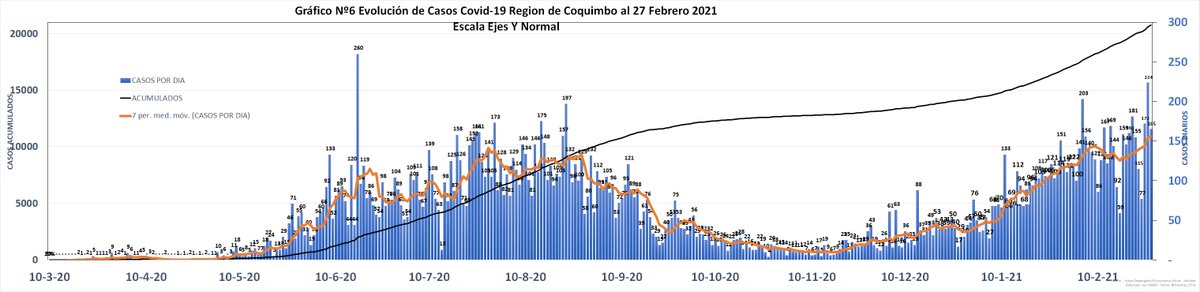
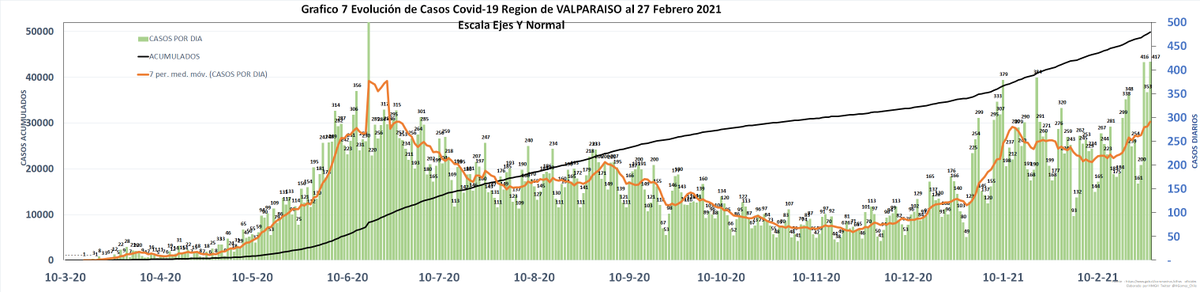
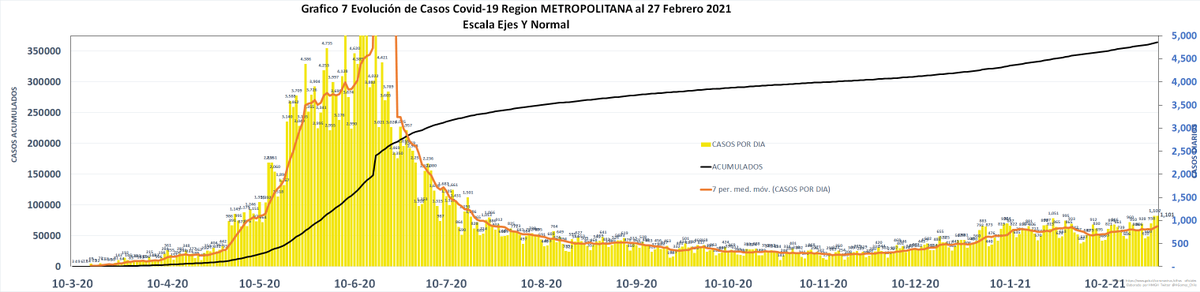
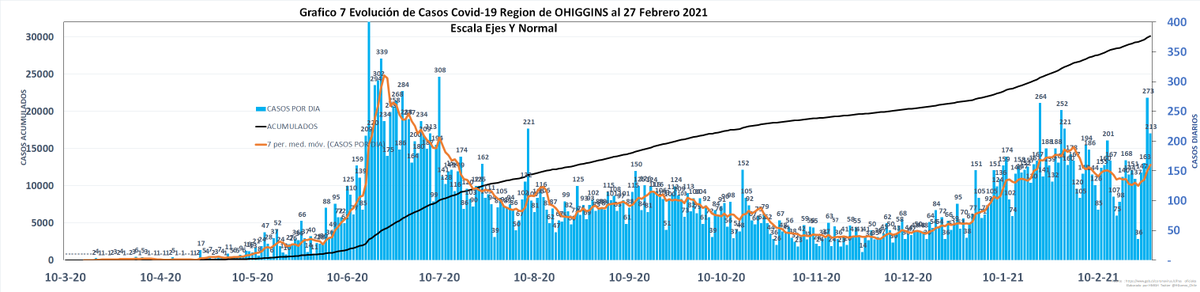
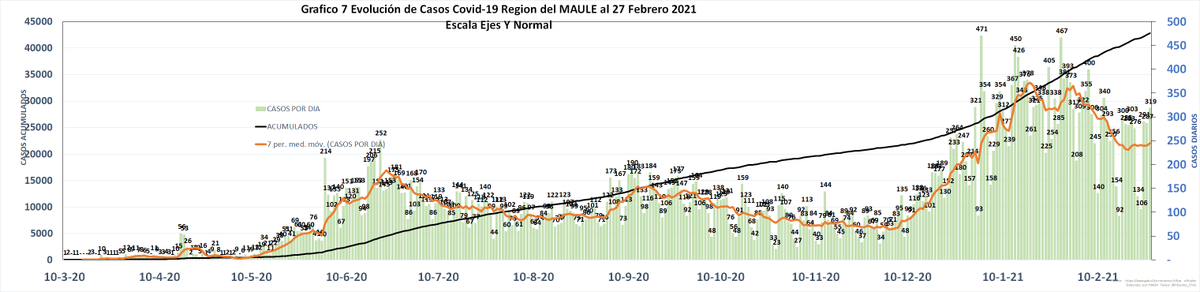
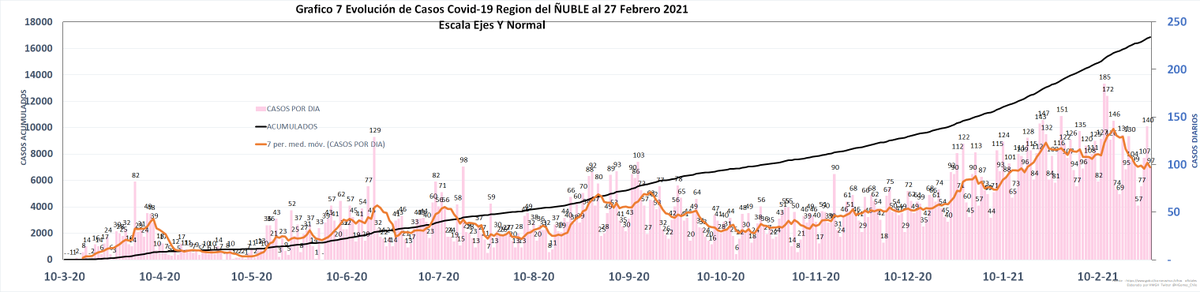
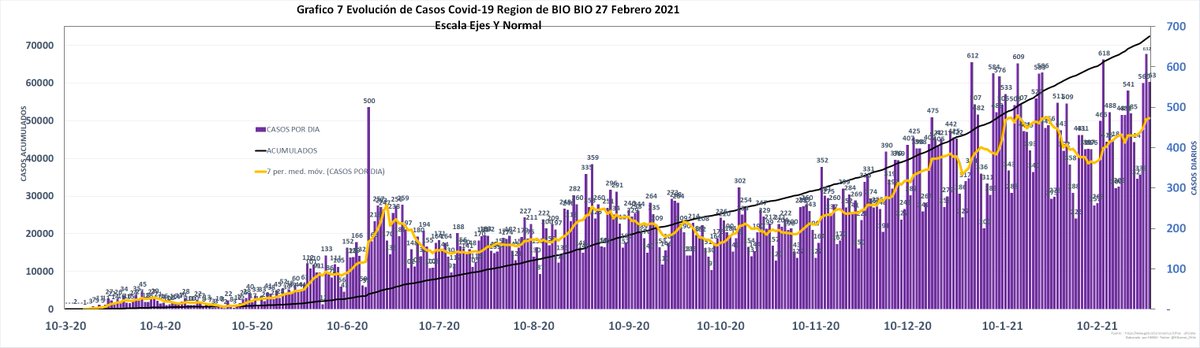
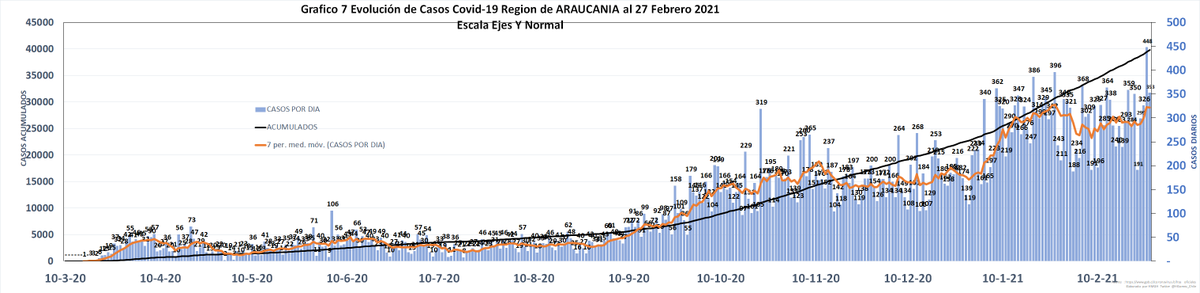
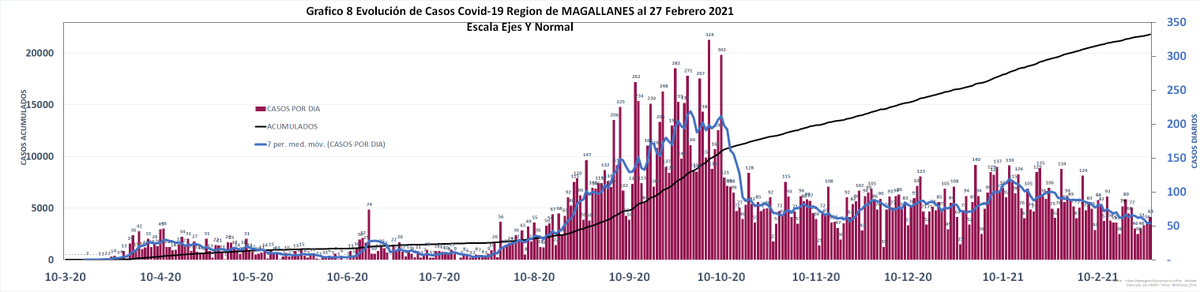
Curvas de Casos día por Región, con tendencia media móvil de 7 dias.
En todas las curvas aparece un valor alto el 17.06 corresponde a los casos perdidos por descuadres del anterior ministro.
Los ejes y dependen de cada región.
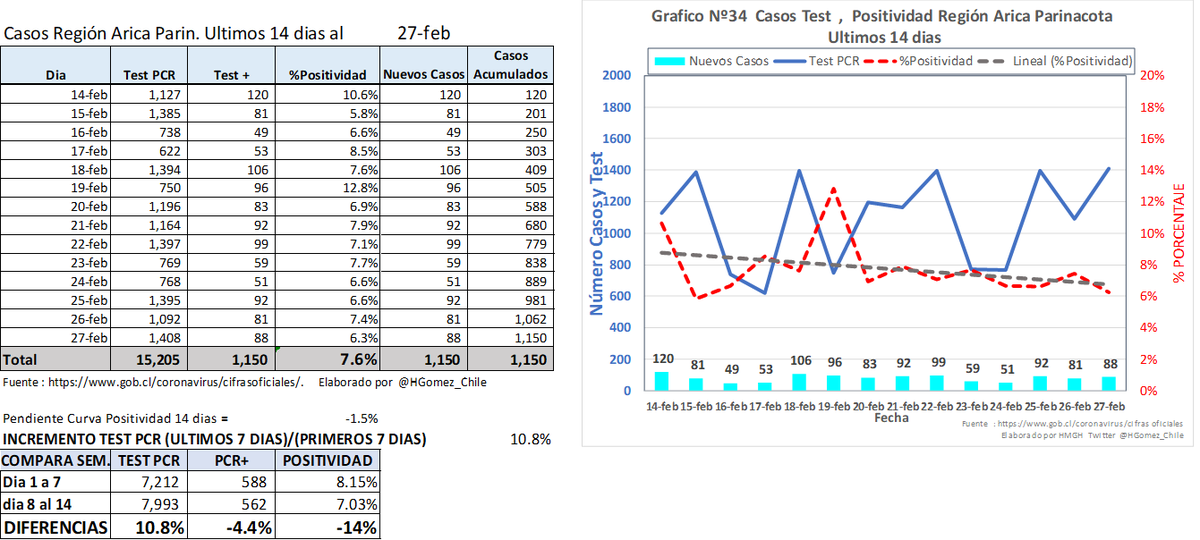
Arica
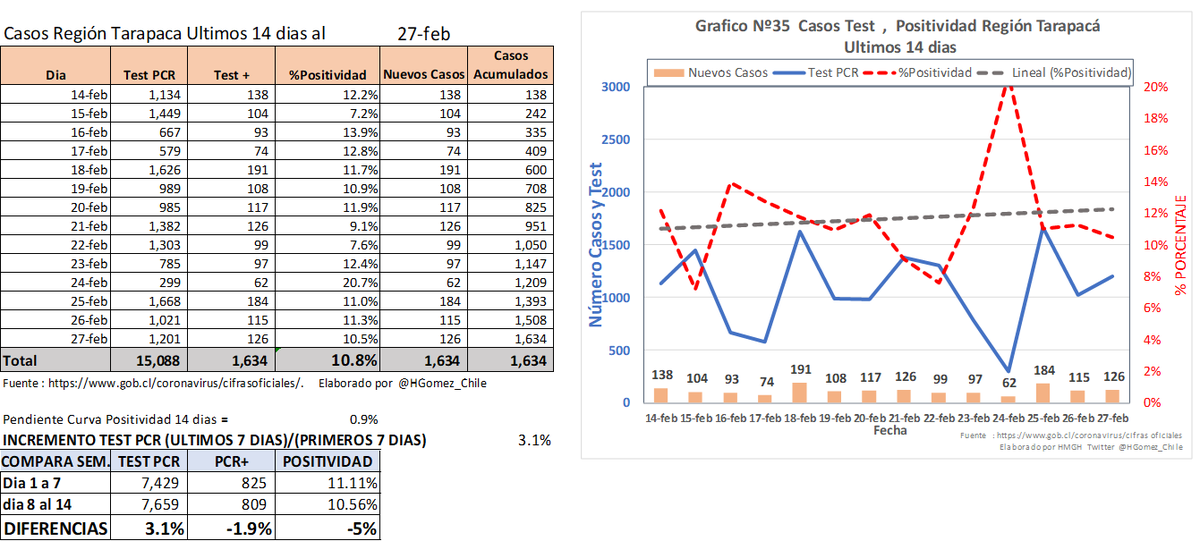
Tarapacá
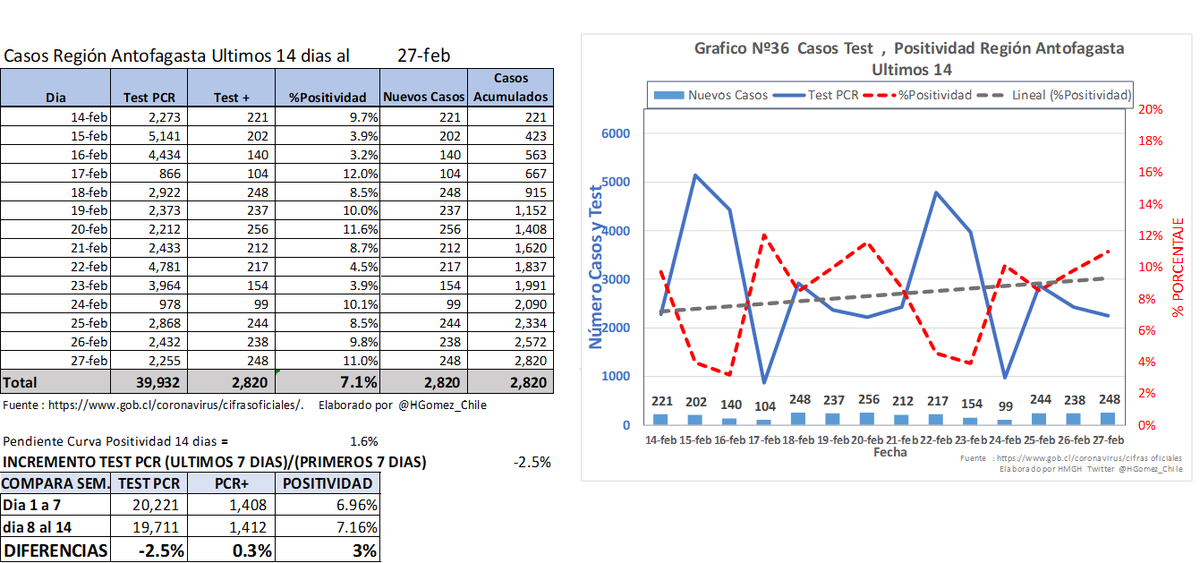
Antofagasta
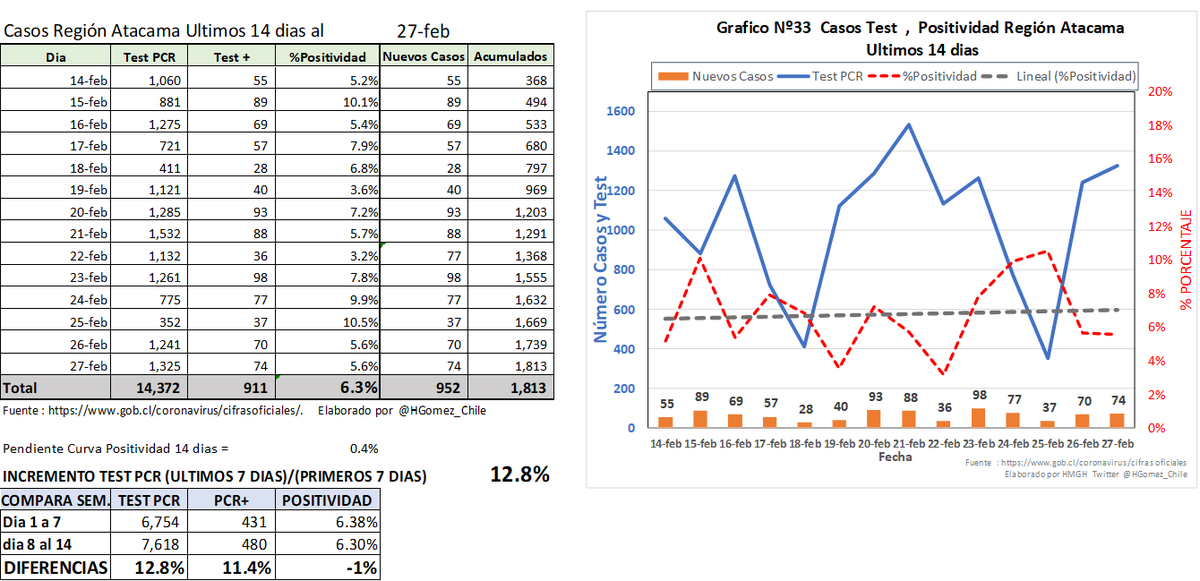
Atacama
1/5
Curvas de Casos día por Región, con tendencia media móvil de 7 dias.
En todas las curvas aparece un valor alto el 17.06 corresponde a los casos perdidos por descuadres del anterior ministro.
Los ejes y dependen de cada región.
Arica
Tarapacá
Antofagasta
Atacama
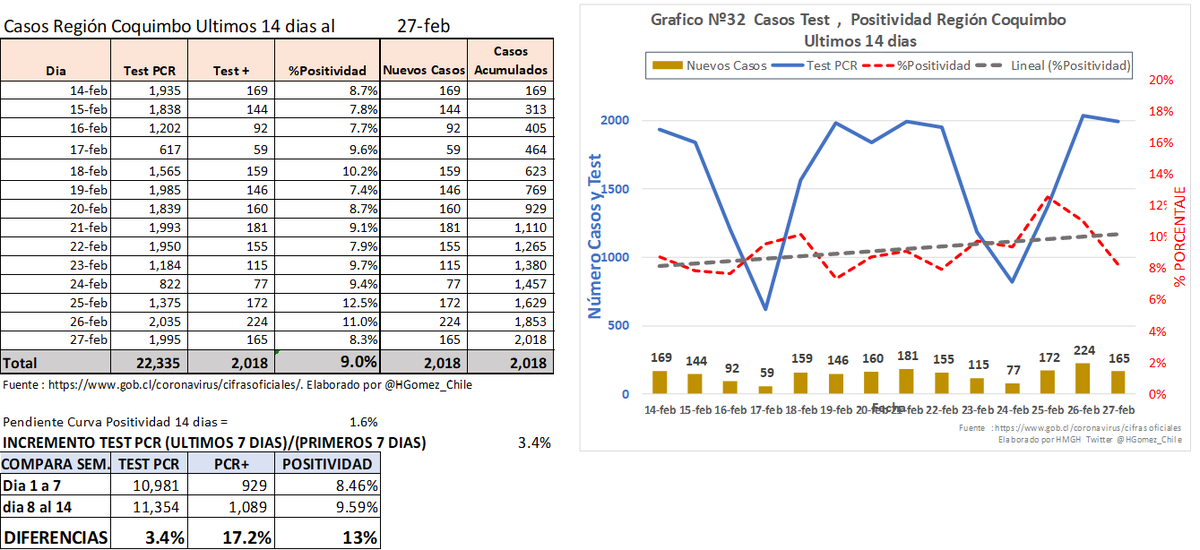
Coquimbo
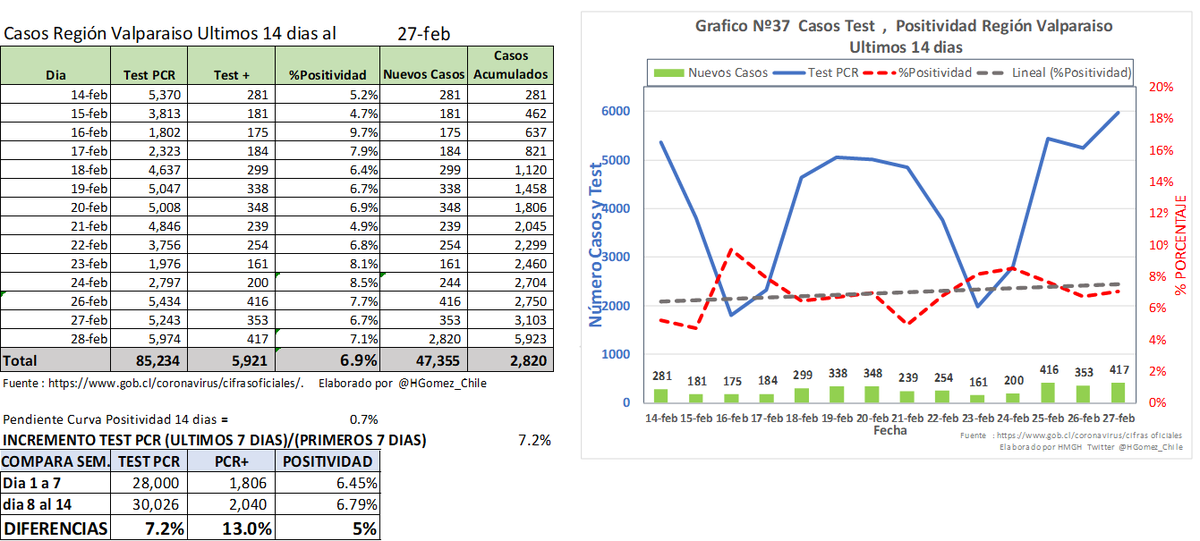
Valparaiso
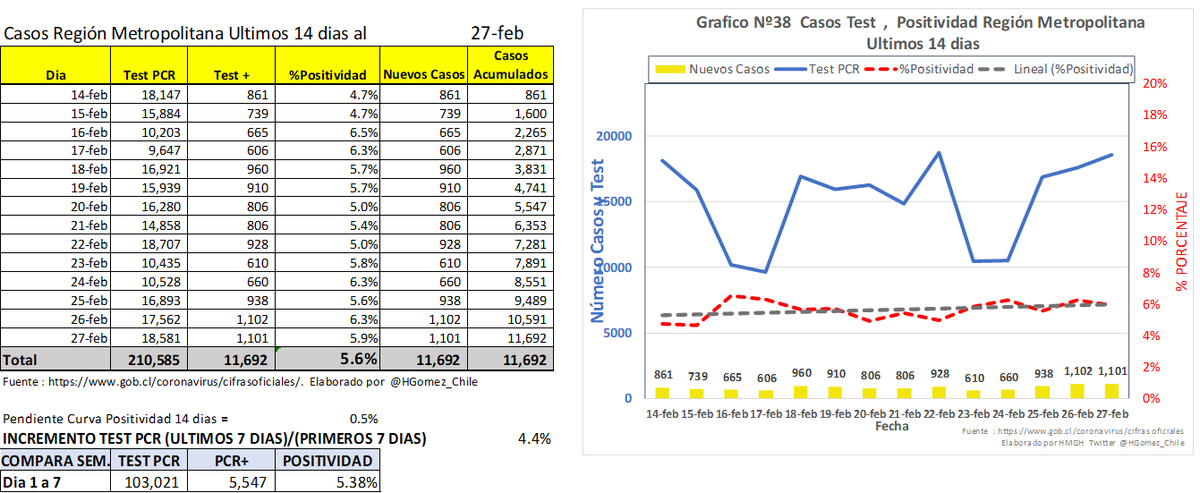
RM
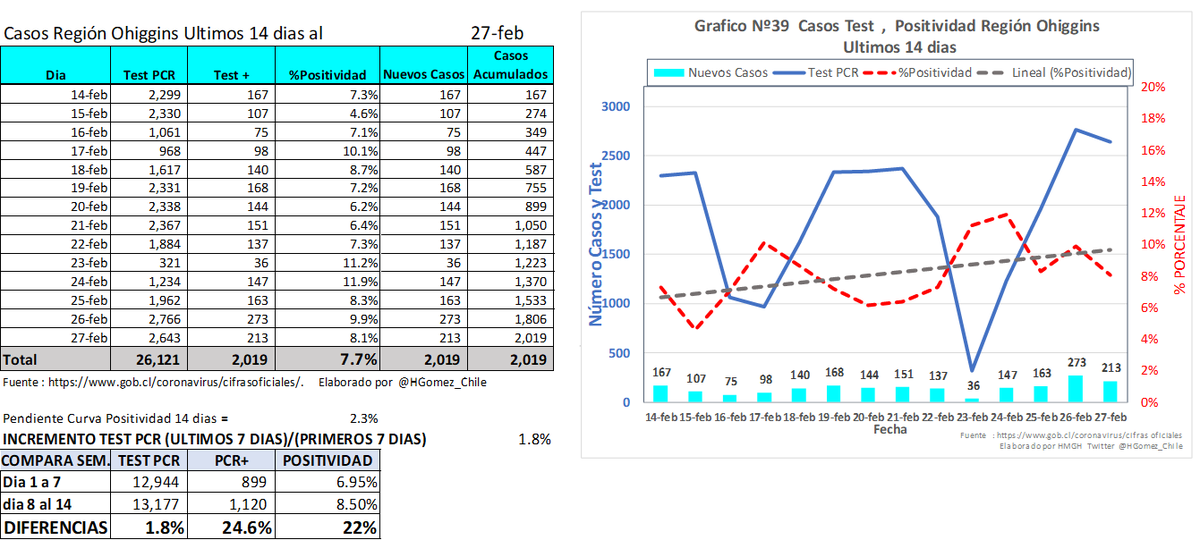
O'Higgins
Valparaiso
RM
O'Higgins
3/5
Maule
Ñuble
Bio Bio
Araucanía
Maule
Ñuble
Bio Bio
Araucanía
(4/5)
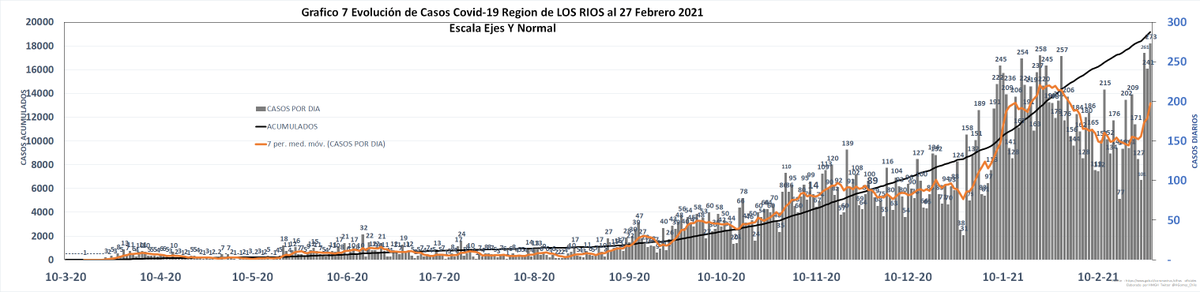
Los Rios
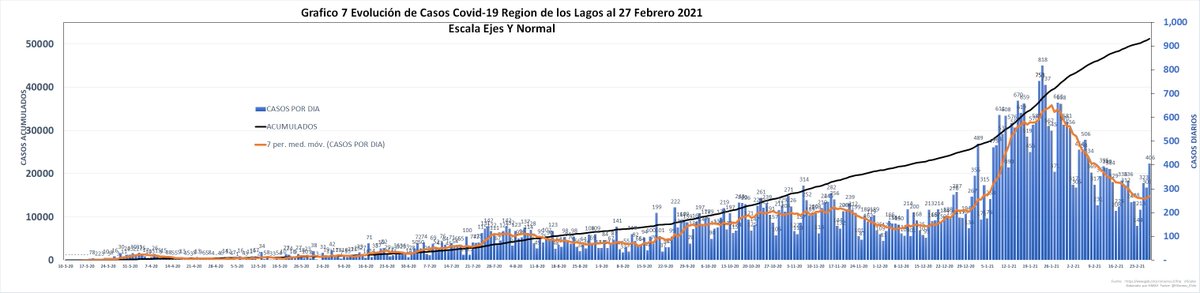
Los Lagos
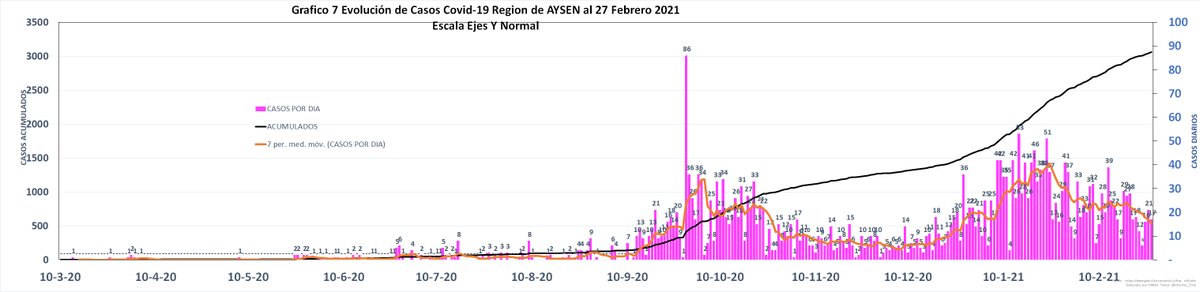
Aysen
Magallanes
Los Rios
Los Lagos
Aysen
Magallanes
(5/5)
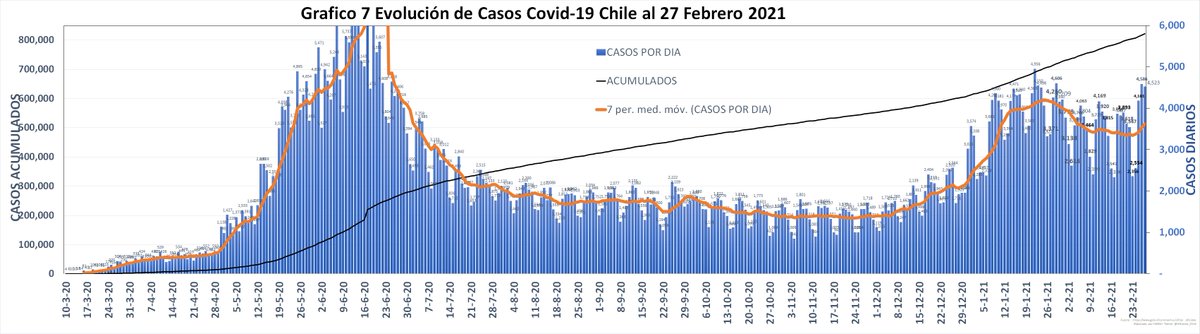
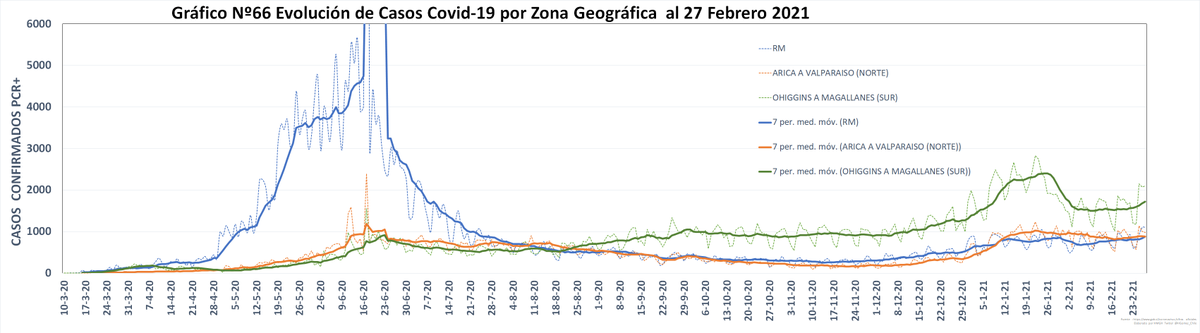
Resumen País, y dividido por Norte, RM y Sur.
Resumen País, y dividido por Norte, RM y Sur.
• • •
Missing some Tweet in this thread? You can try to
force a refresh