@covid19cl
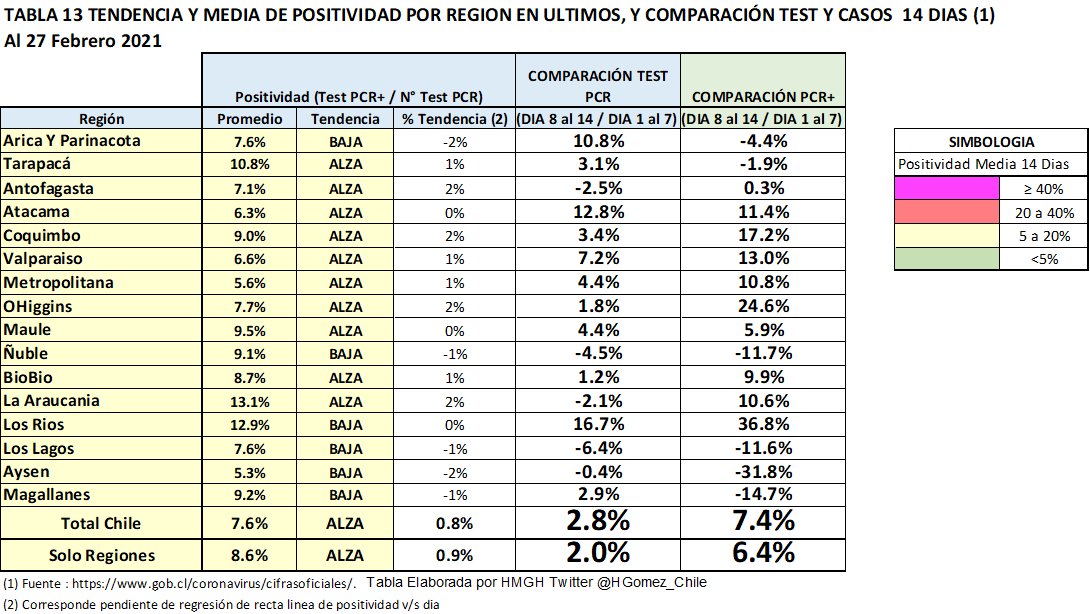
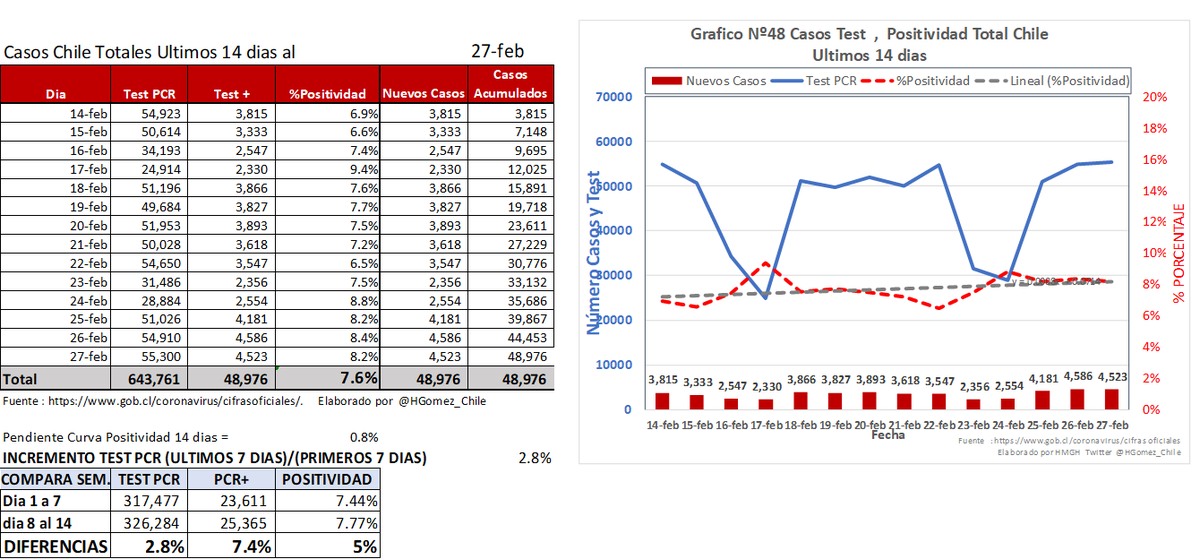
(1/6) Positividad 14d y Comparación Test y casos.
Ejemplo
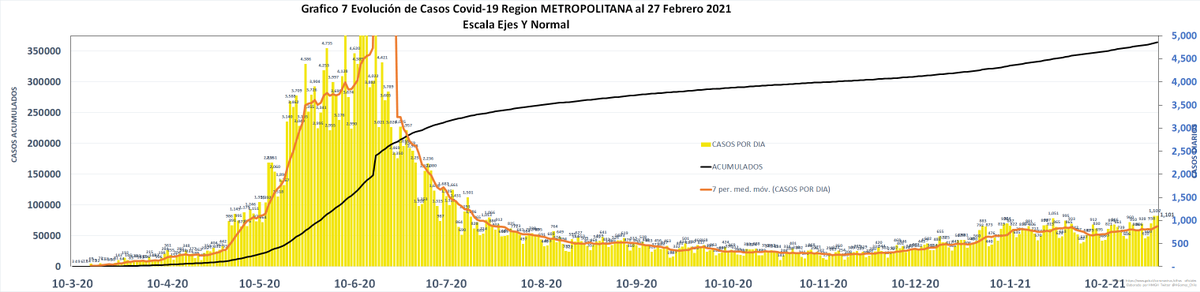
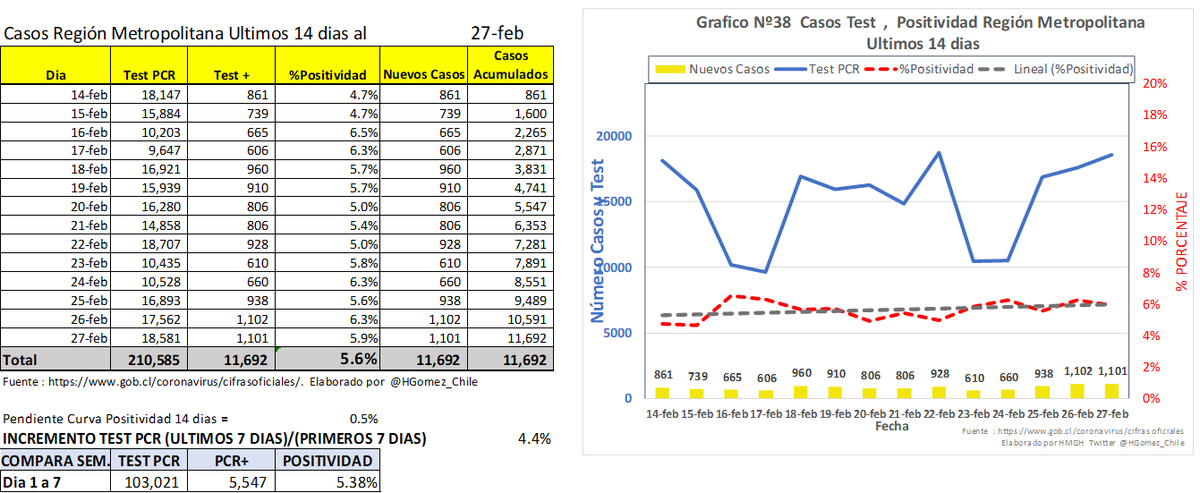
RM 5.6 Positividad, Test Suben 4.4% y Casos suben 10.8%
Si % aumento casos > aumento se test suben positividad es mal índice (sube positividad)
Hilo con detalle de cada Región
(1/6) Positividad 14d y Comparación Test y casos.
Ejemplo
RM 5.6 Positividad, Test Suben 4.4% y Casos suben 10.8%
Si % aumento casos > aumento se test suben positividad es mal índice (sube positividad)
Hilo con detalle de cada Región
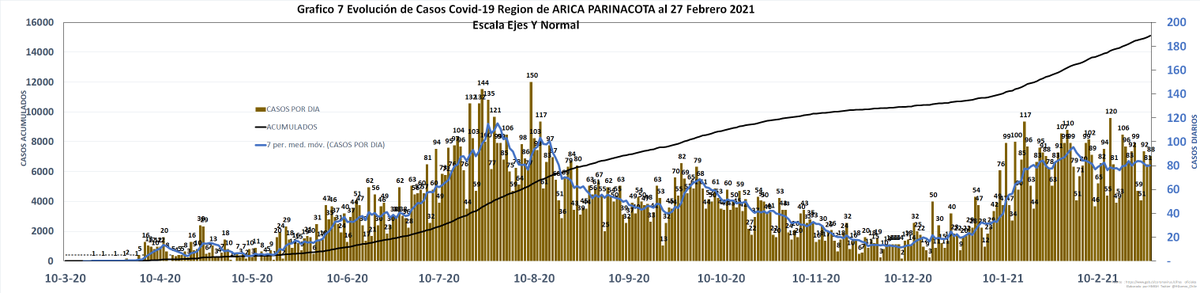
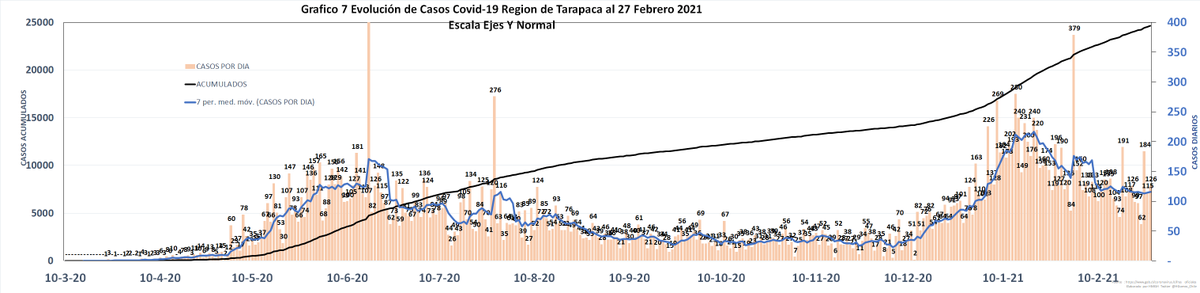
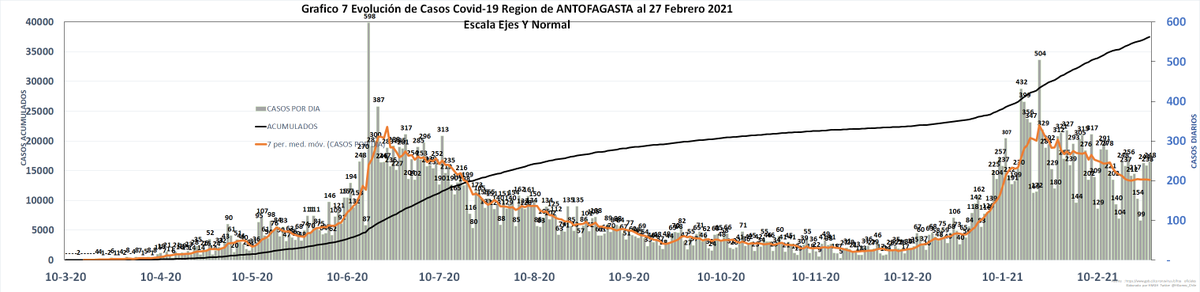
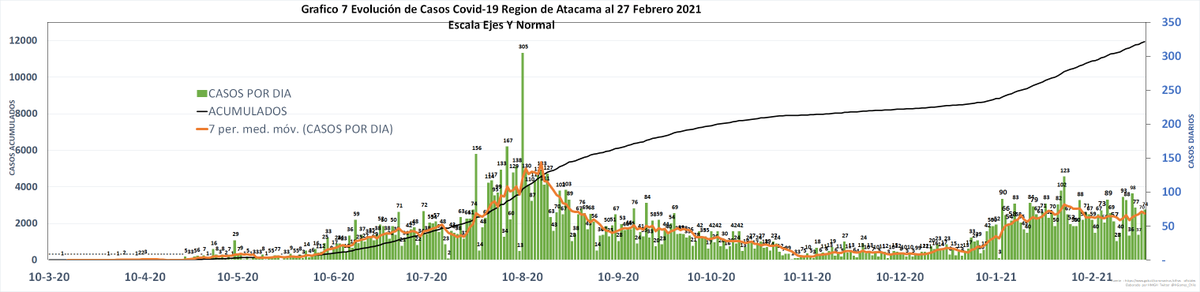
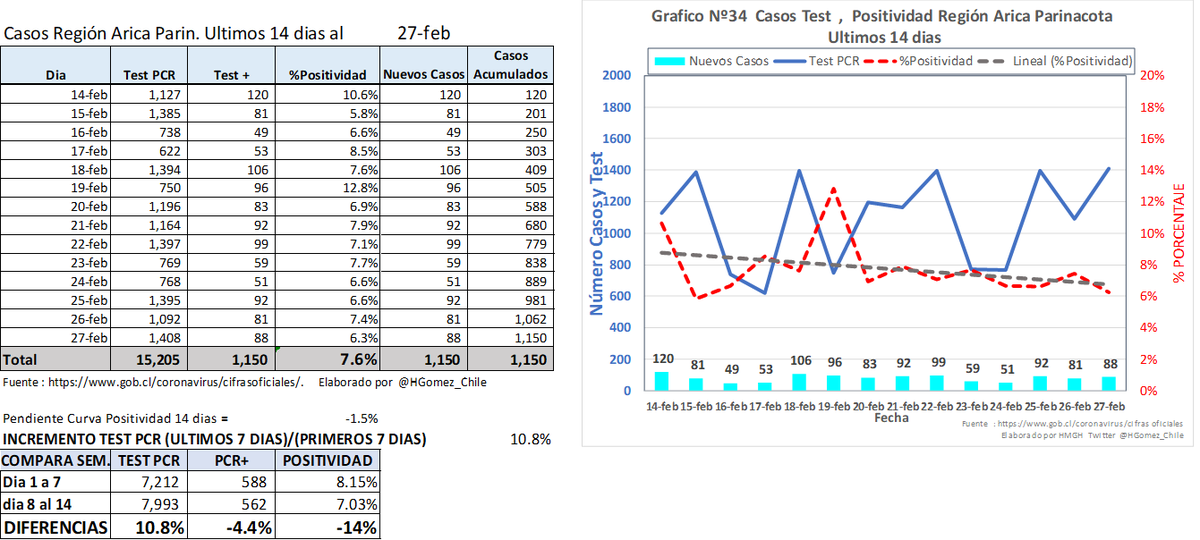
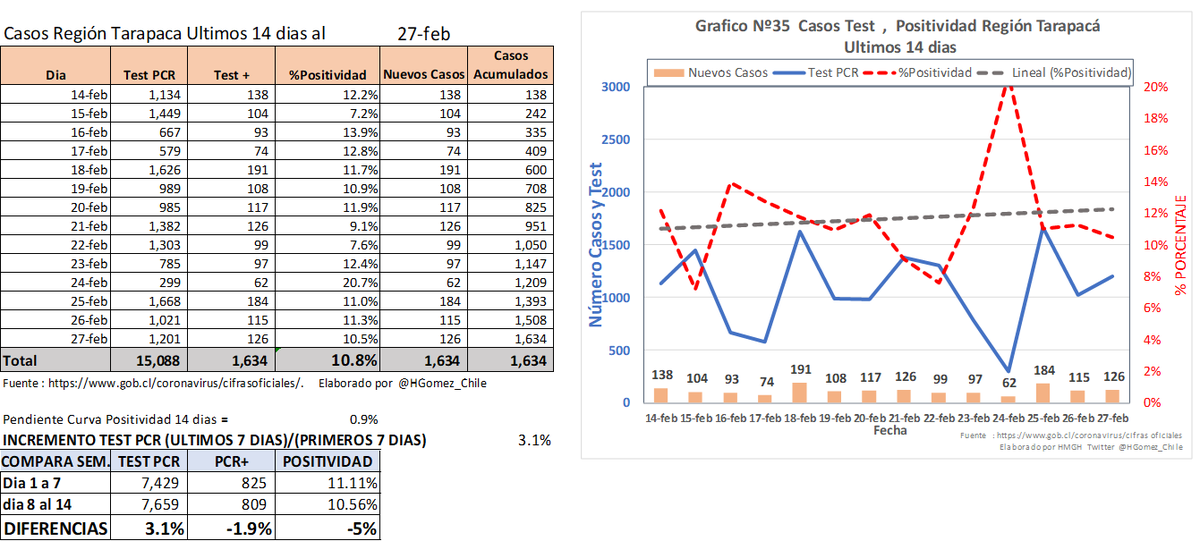
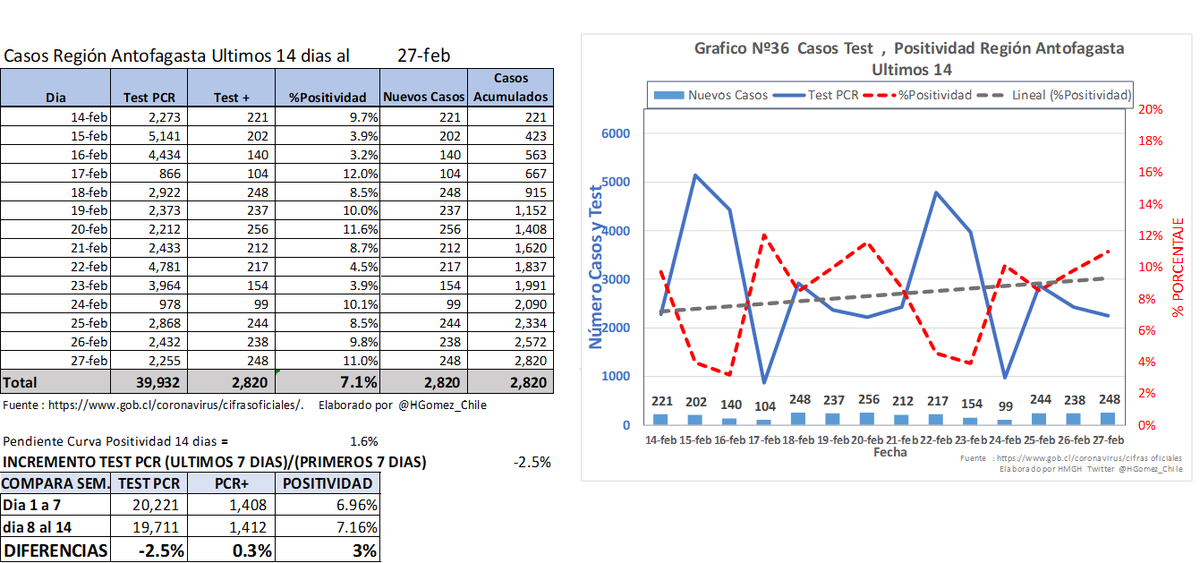
(2/6)
Arica
Tarapacá
Antofagasta
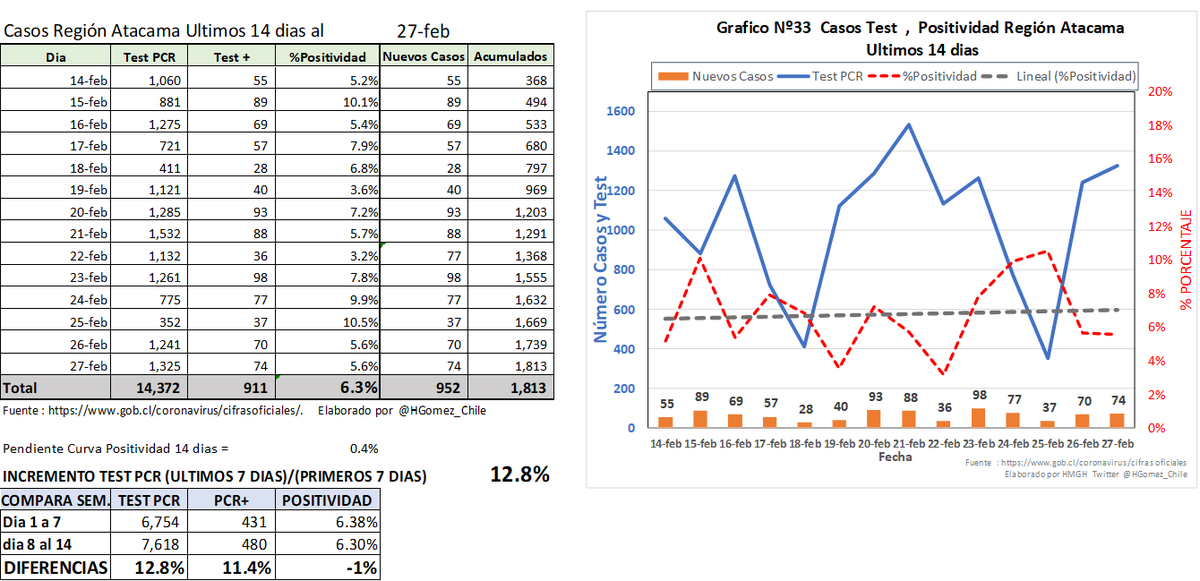
Atacama
Arica
Tarapacá
Antofagasta
Atacama
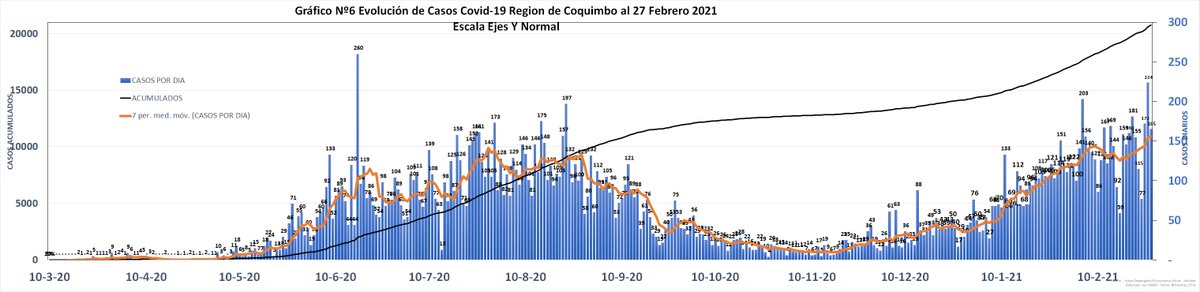
(3/6)
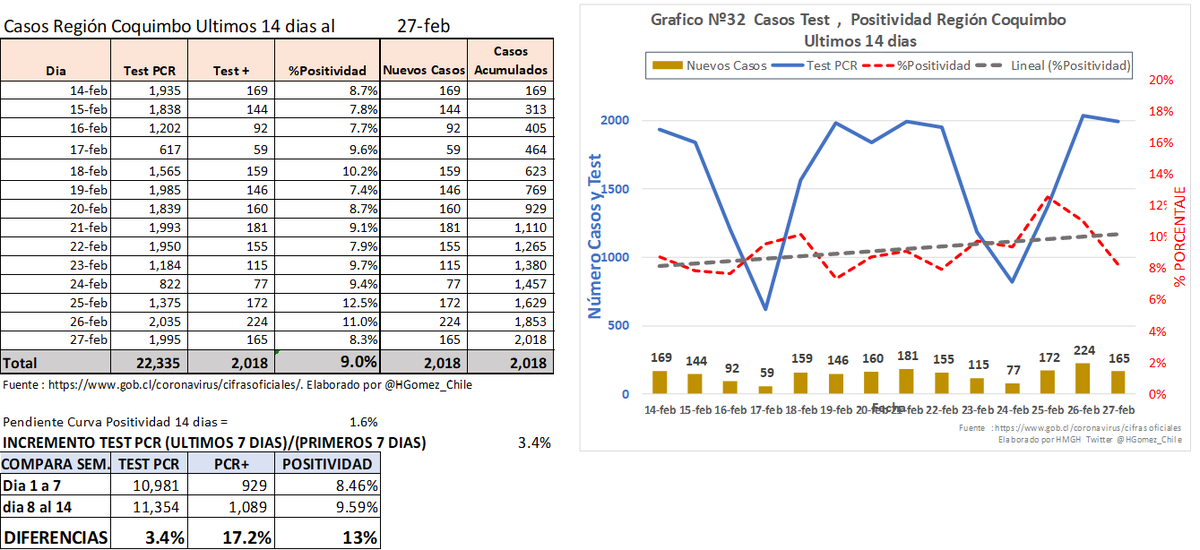
Coquimbo
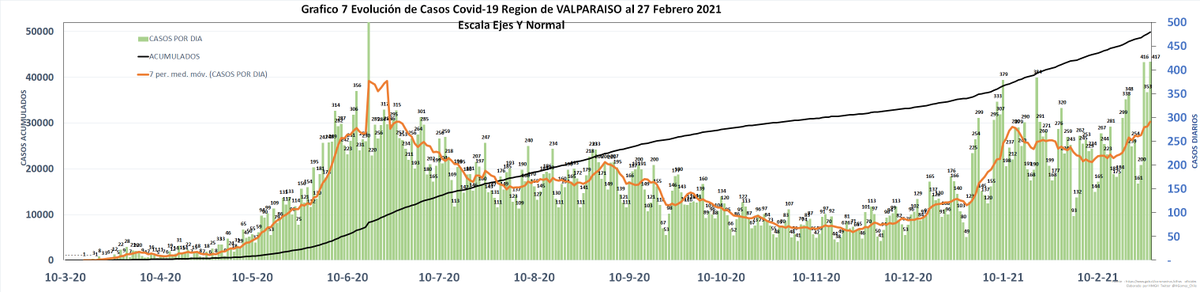
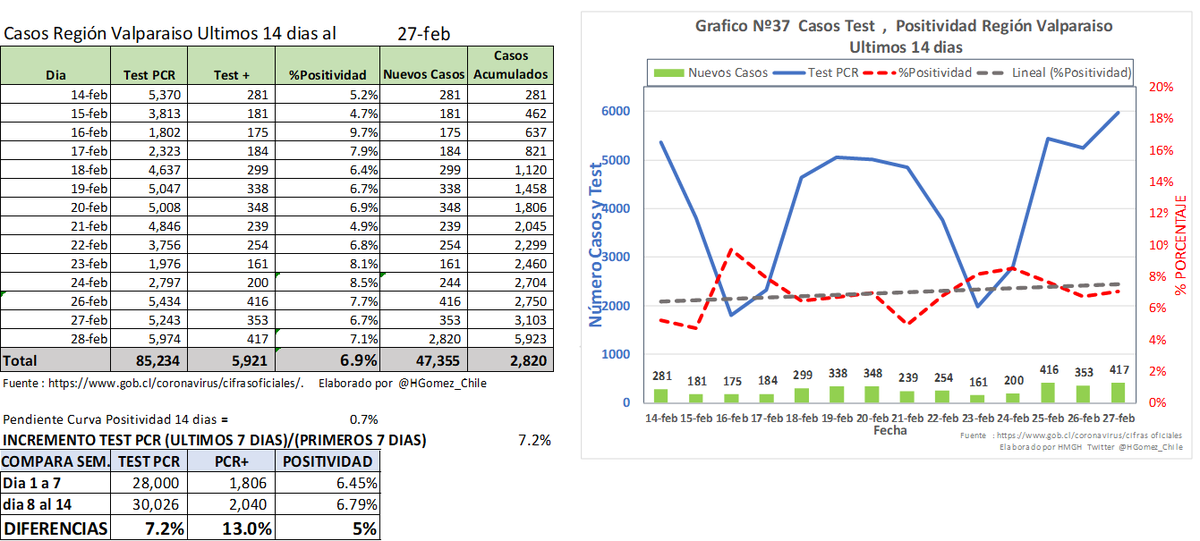
Valparaíso
RM
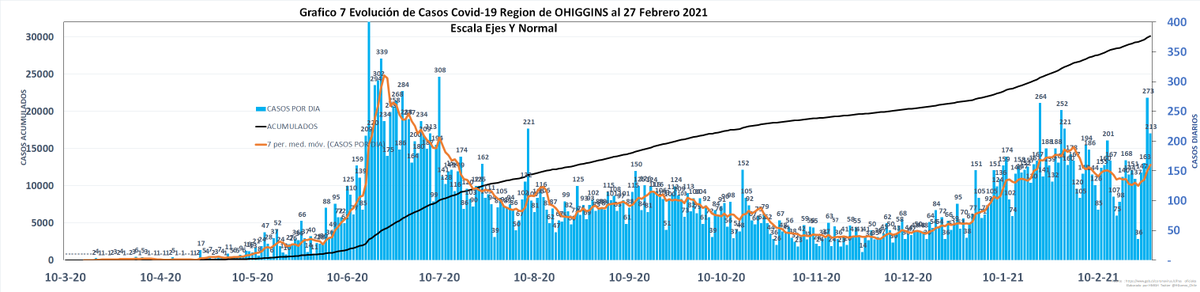
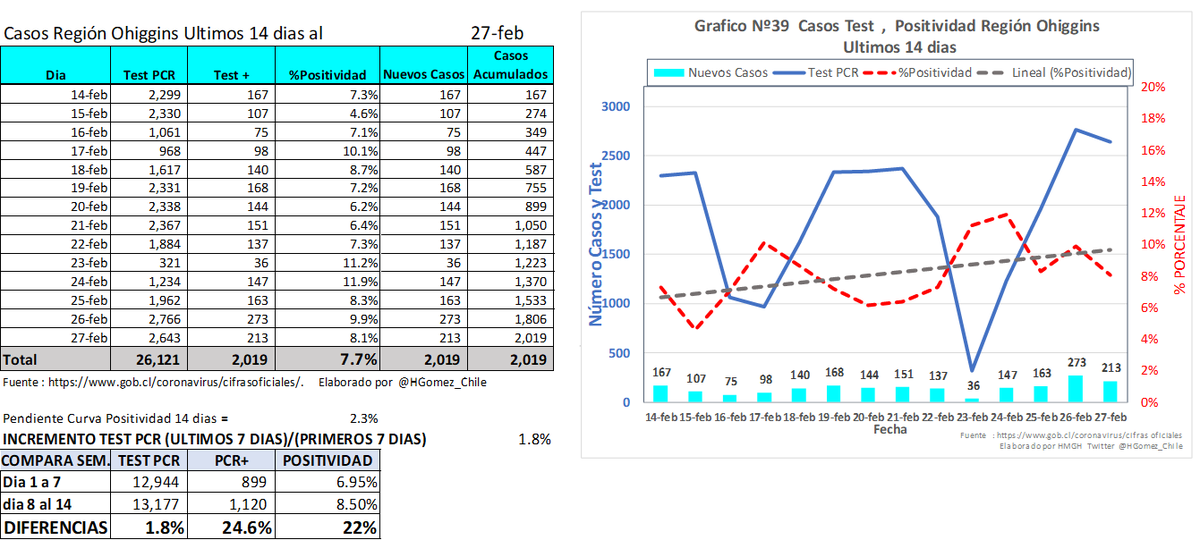
OHiggins
Coquimbo
Valparaíso
RM
OHiggins
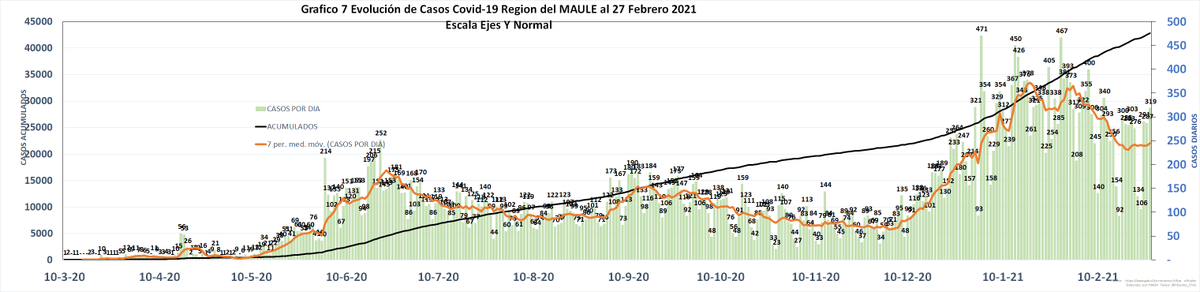
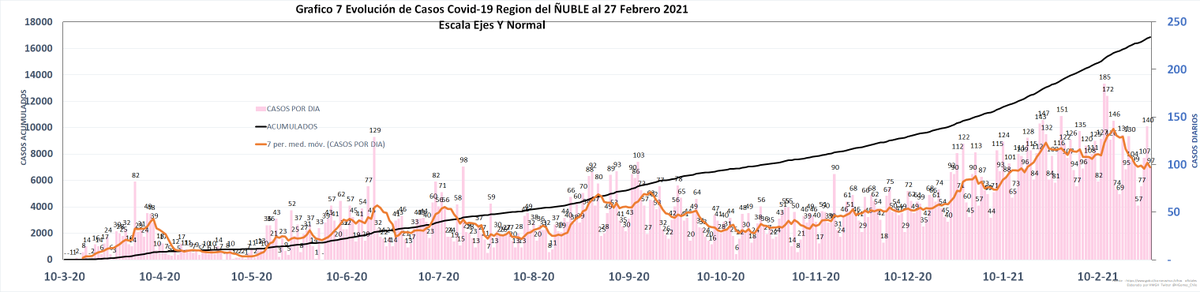
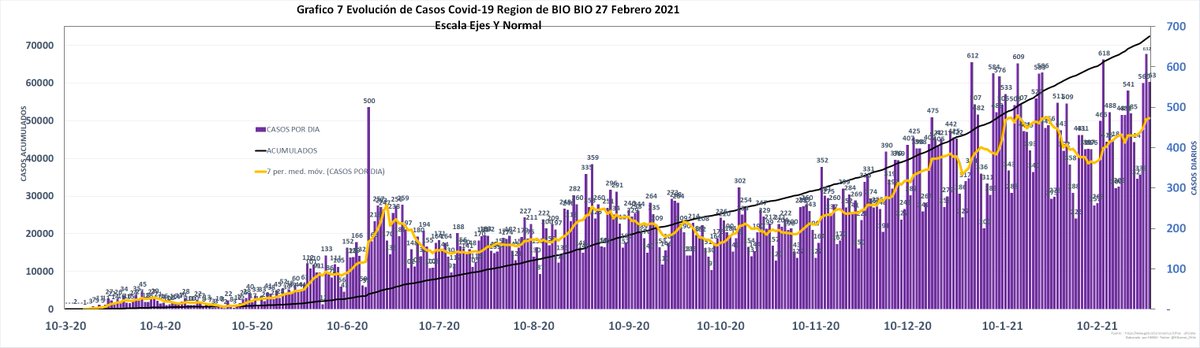
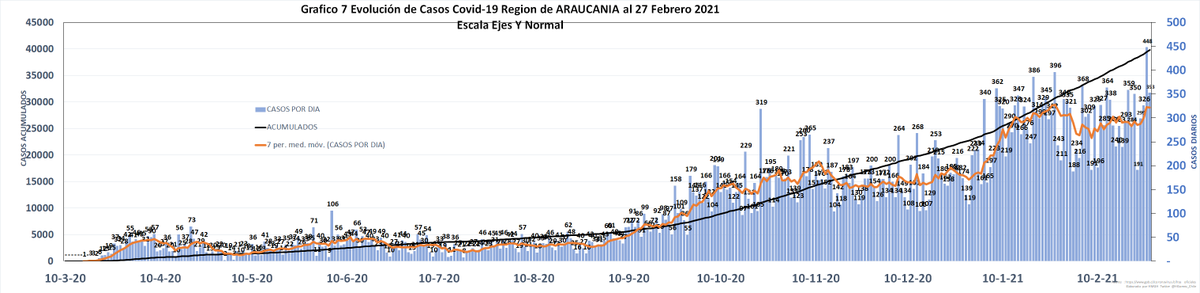
(4/6)
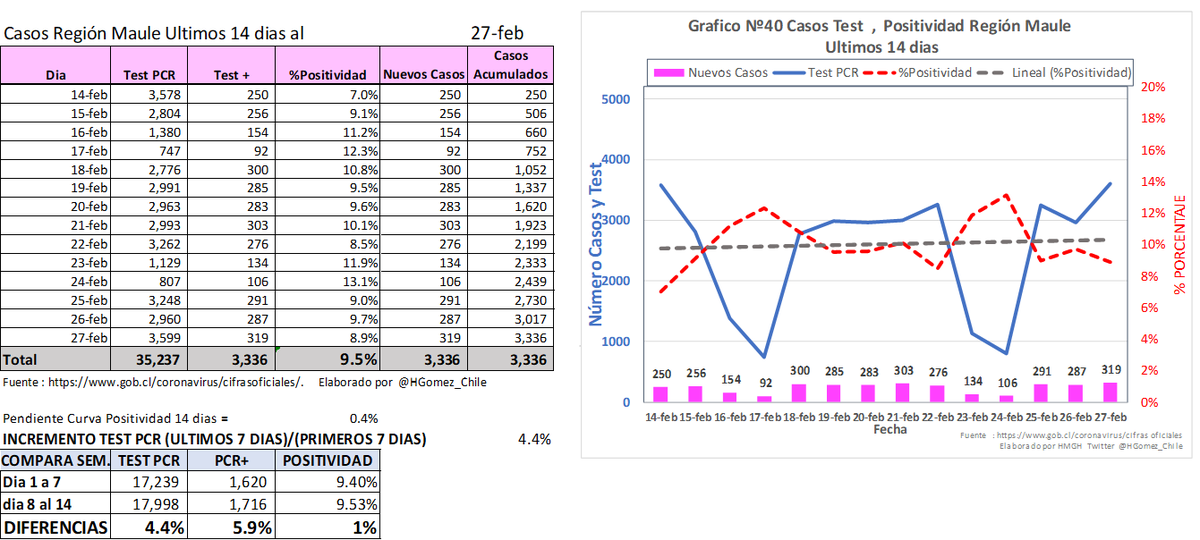
Maule
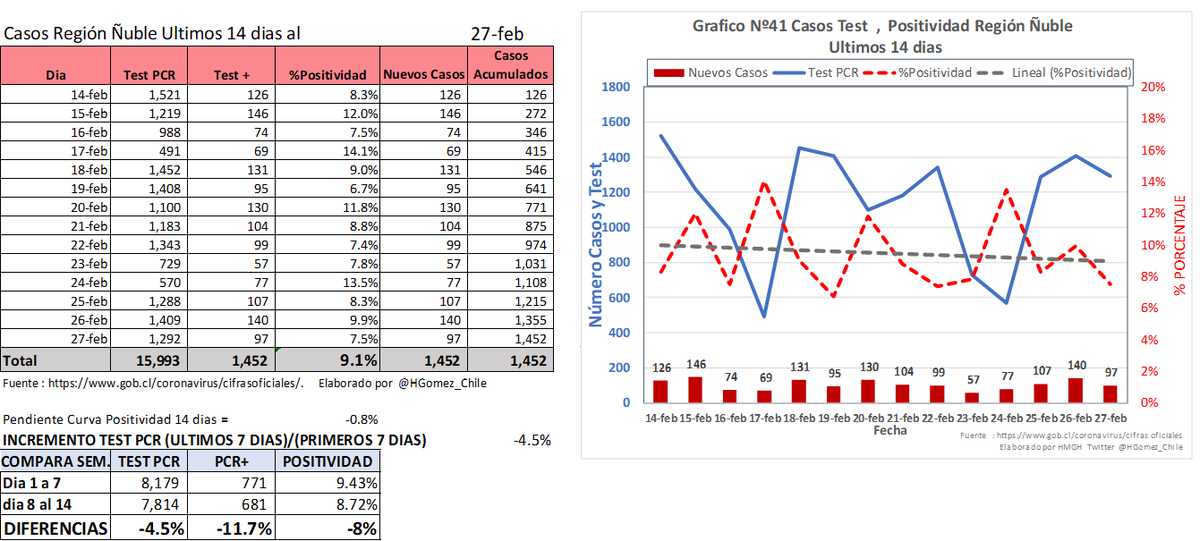
Ñuble
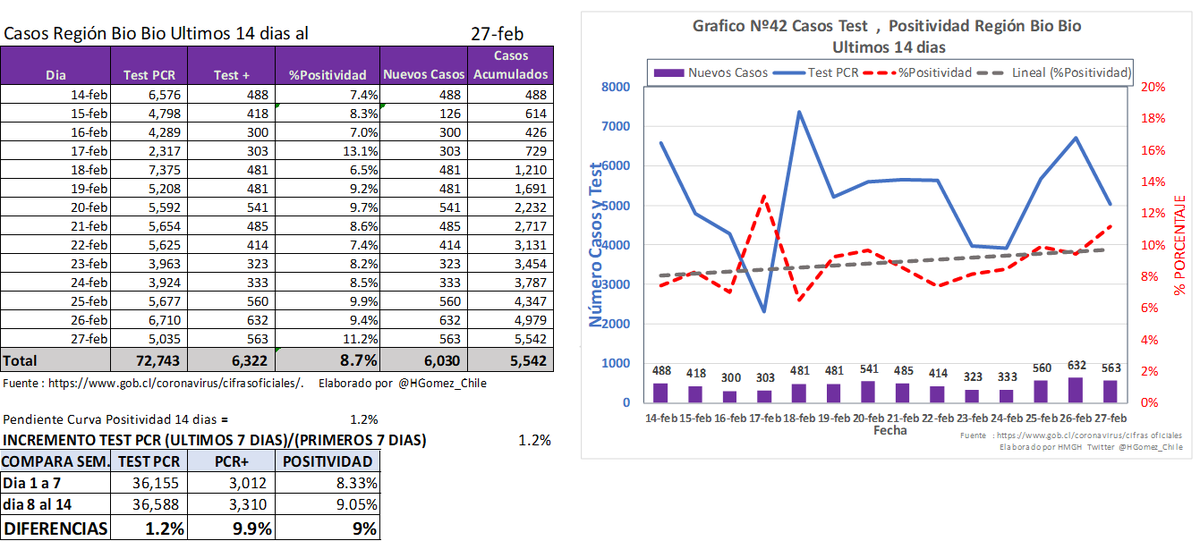
Bio Bio
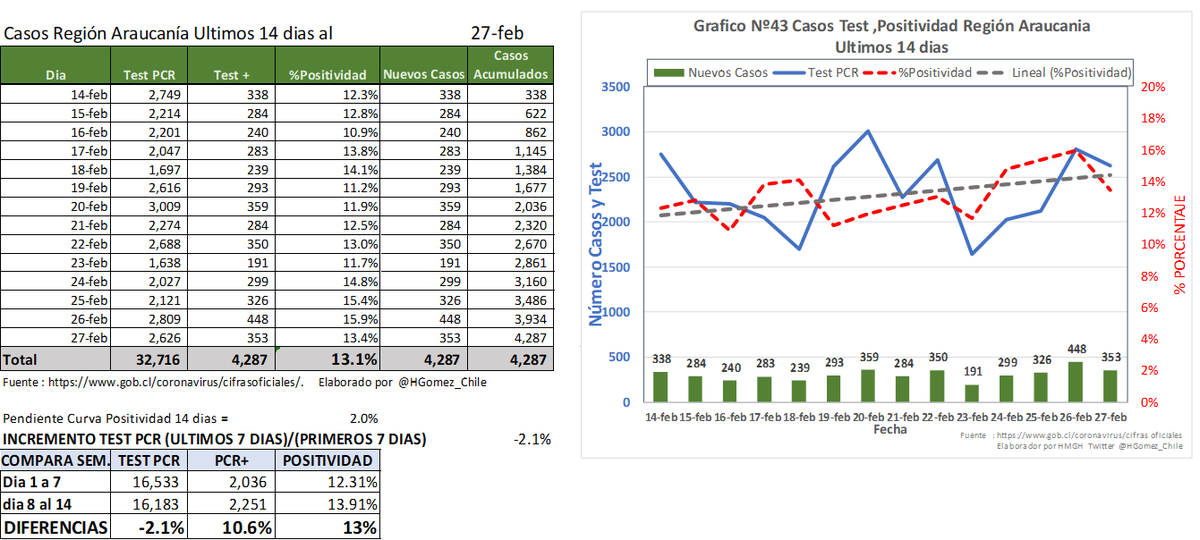
Araucanía
Maule
Ñuble
Bio Bio
Araucanía
(5/6)
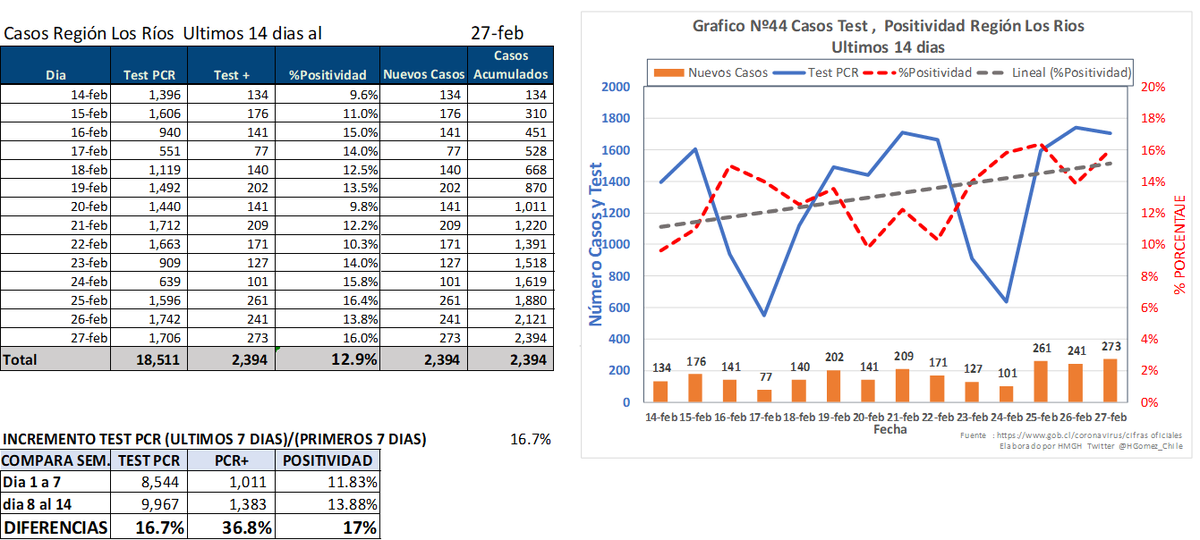
Los Rios
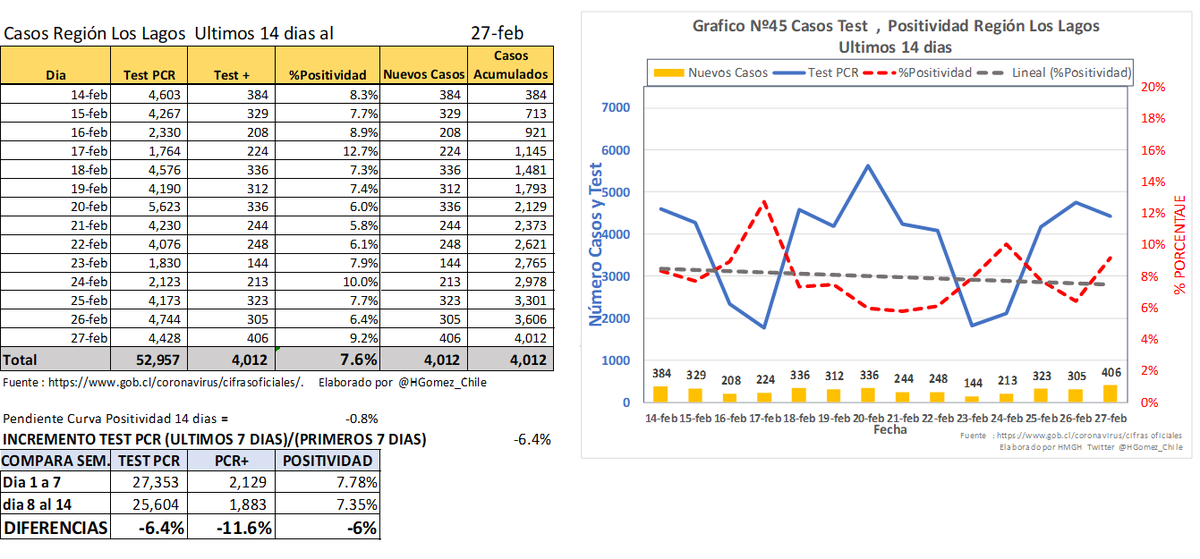
Los Lagos
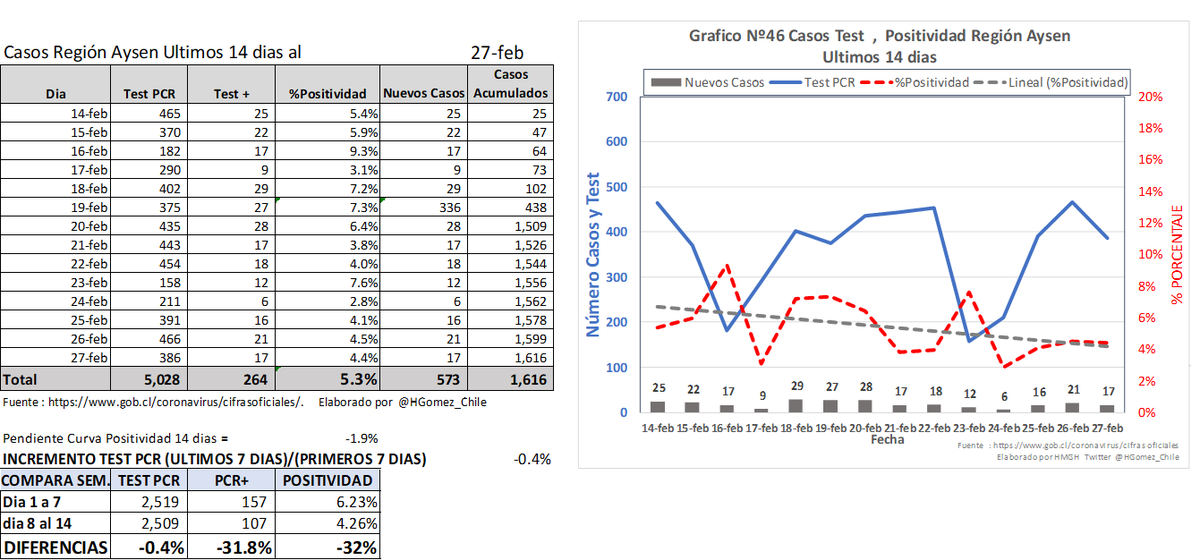
Aysén
Magallanes
Los Rios
Los Lagos
Aysén
Magallanes

(6/6)
Total Chile
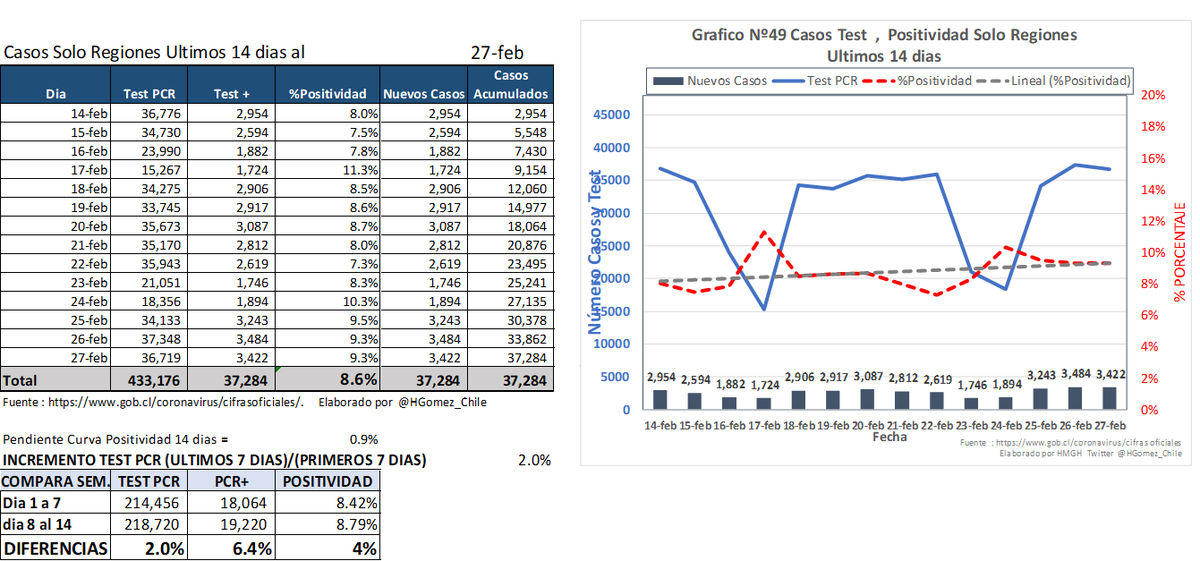
Total Regiones
Total Chile
Total Regiones
• • •
Missing some Tweet in this thread? You can try to
force a refresh