All right, took some time to reflect on bigger picture of $ES
Imo we closed in no (wo)man's land leaving both sides🤔
There is a fairly sizeable air pocket to the downside but I personally don't like "betting" big on weakness that's so "advertised" thus I'm neutral
/n
Imo we closed in no (wo)man's land leaving both sides🤔
There is a fairly sizeable air pocket to the downside but I personally don't like "betting" big on weakness that's so "advertised" thus I'm neutral
/n
First off let's look at $ES , it was actually on its way to a pretty decent close above the +1 std dev on weekly but it's like at 3:45 someone said "fuck that"
I've mentioned before for sellers I prefer closes above as it keeps buyers comfortable and you can shock them on OVN
I've mentioned before for sellers I prefer closes above as it keeps buyers comfortable and you can shock them on OVN


In fact this weekly close was very similar to the one on Jan 29th (last day of Jan 25th week), after what was supposed to be after our "black swan" event 🙄
See the second pic for how that panned out into Friday close, Sunday open and what was a big reversal into Monday's RTH
See the second pic for how that panned out into Friday close, Sunday open and what was a big reversal into Monday's RTH


An important feature of that reversal on Sunday night was a scary open that poked down all the way to the +0.5 std dev ... that's a lot of trapped energy and why the week after was such a quick and powerful reversal
Gaining by 3850 by Monday close would be an important step
Gaining by 3850 by Monday close would be an important step

So that's the scenario I'm watching but if we open below this box and having trouble by day's close this is the kind of air pocket to consider below $ES
These are key targets on accelerated selling not predictions, it's good to have them marked before hand
These are key targets on accelerated selling not predictions, it's good to have them marked before hand

The 500 DMA lines right up with where 2020 closed its YTD VWAP which is a pivotal level on 6-8 week bear markets
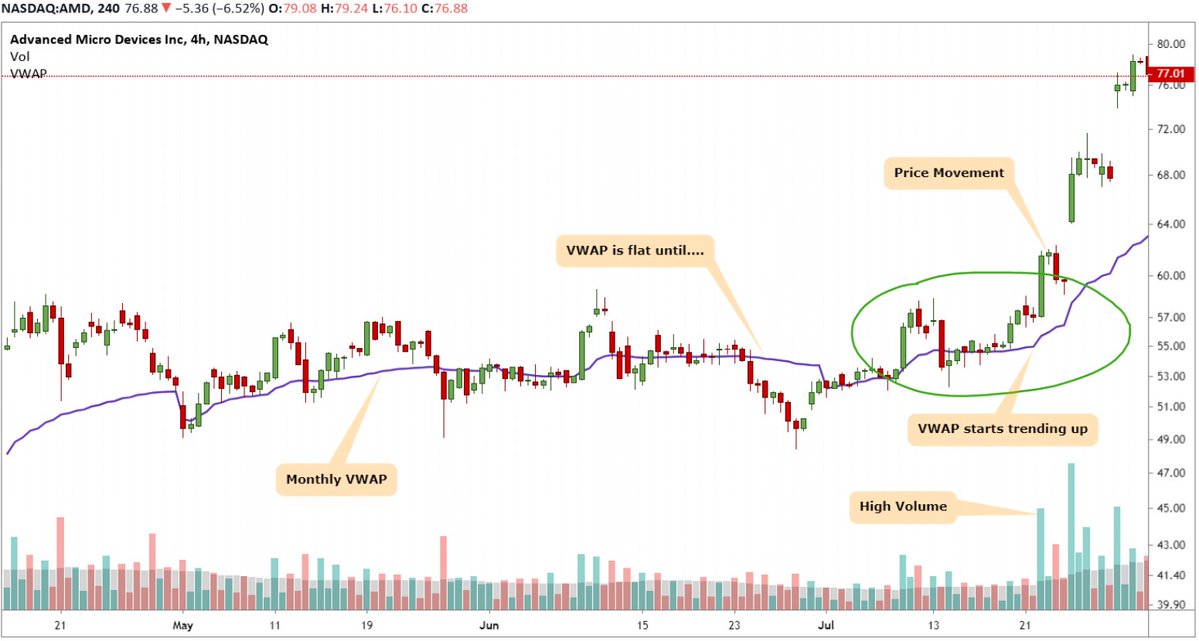
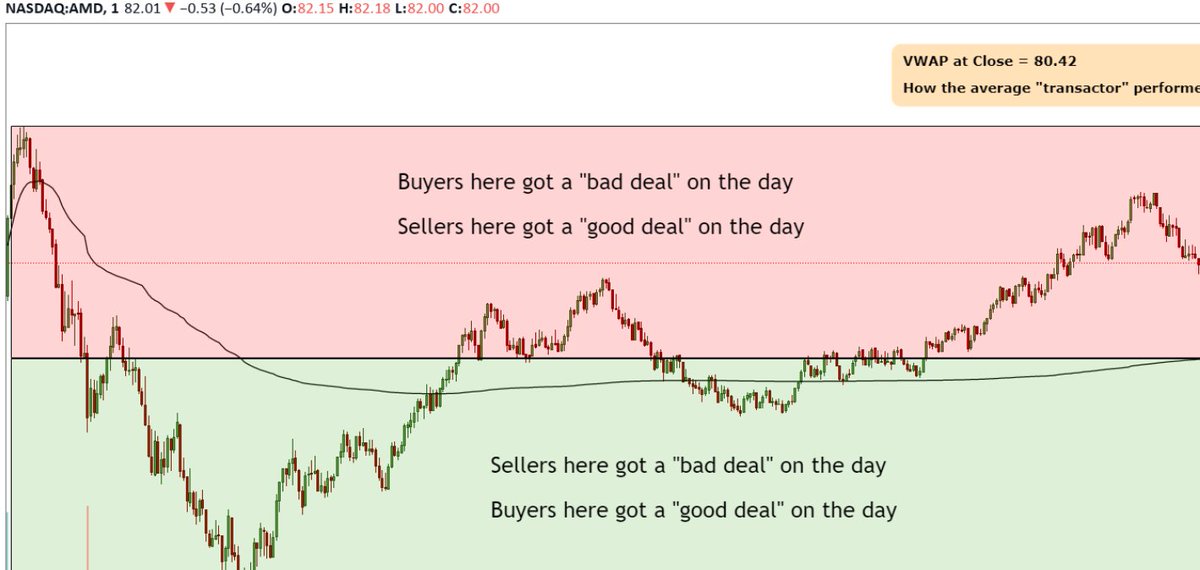
These YTD VWAP closes are horizontal (blue line) levels that represent fair transactional value for that year...
These YTD VWAP closes are horizontal (blue line) levels that represent fair transactional value for that year...

therefore when shit hits the fan and we're getting accelerated selling there is a purge of everyone who positioned above this level...then when the market gets there the hands of "fair value or lower" buyers gets tested

In fact, let's assume the first "year" of this bull market is 2010.
We've had only 4 years (red) where the previous YTD VWAP close was not lost, tested or gained
7 years (blue), including the last 3 we've had an interaction with this horizontal level at some point
We've had only 4 years (red) where the previous YTD VWAP close was not lost, tested or gained
7 years (blue), including the last 3 we've had an interaction with this horizontal level at some point

You'll notice that the years that didn't have a backtest were nice and trendy about their YTD VWAP (thick green line) and currently we're right at 2021's YTD VWAP
Anyways, in conclusion I personally will not be dogmatic about what happens next (yes I know I have been in the past)...my hunch is that the advertisement of the weakness throughout the entire week and into close CAN turn trapped energy into fuel for next leg up to 3980-4040 area

However, after the numerous times this "trap" has worked in the favor of buyers you have to consider the shock they would be dealt if we do glide down...that's where marking key levels and areas ahead of time in the midst of panic selling can help you prepare and not shoot blanks

➕Addendum
2 nuances that are red flags for bear side
Til late in Friday RTH session everything was gucci so it's almost like the close was "painted" bearish
Those who held through Tuesday's panic got to load up puts / trim near highs
Bigger sells are usually less forgiving
2 nuances that are red flags for bear side
Til late in Friday RTH session everything was gucci so it's almost like the close was "painted" bearish
Those who held through Tuesday's panic got to load up puts / trim near highs
Bigger sells are usually less forgiving
I said "let's look at $ES" cause I was gonna analyze $NQ too but skipped it to hang out with my sons
• • •
Missing some Tweet in this thread? You can try to
force a refresh