TN State Sales Tax collection from Petroleum Products

2008-09 : ₹5882 Crores
2010-11 : ₹7684 Crores
2012-13 : ₹11281 Crores
2014-15. : ₹12310 Crores

VAT for Transport fuel was 30% up until 2010-11 and was reduced to 27%. ImageImage
Despite reduction in state VAT, VAT collection continued to grow till 2013-14 due to increase in diesel consumption & stabilised from there.

Such was the power situation during DMK’s regime. Image
UPS/ Invertor Sales sky rocketed during this period.

On the other side DMK was looting people by not reducing VAT on fuels even though the consumption went up due to their legacy.

• • •

Missing some Tweet in this thread? You can try to force a refresh
 

Keep Current with Krishna Kumar Murugan

Krishna Kumar Murugan Profile picture

Stay in touch and get notified when new unrolls are available from this author!

Read all threads

This Thread may be Removed Anytime!

PDF

Twitter may remove this content at anytime! Save it as PDF for later use!

Try unrolling a thread yourself!

how to unroll video
  1. Follow @ThreadReaderApp to mention us!

  2. From a Twitter thread mention us with a keyword "unroll"
@threadreaderapp unroll

Practice here first or read more on our help page!

More from @ikkmurugan

21 Feb
Fuel Prices: Forgotten Legacy

Let’s see how India has progressed in Oil consumption, Production & Refining capacity

Consumption in Barrels per day
🛢2009 : 32.9 Lakh
🛢2013 : 37.8 Lakh
🛢2019 : 52.7 Lakh

15% growth during UPA2 against 39% growth During NDA1+1.
Oil Production in Barrels per day

🛢2009 : 8.4 Lakh
🛢2013 : 9.3 Lakh
🛢2019 : 8.3 Lakh

Refining Throughput in Barrels per day

🛢2009 : 36.4 Lakh
🛢2013 : 44.6 Lakh
🛢2019 : 51.9 Lakh

In 2019 Oil production levels have decreased below 2009 levels due Depletion of reserves.
While the consumption has increased more than twice the quantity in 10 years, the indigenous production has reduced after reaching its peak in 2011.

This has compelled India to import more than 80% of its oil needs in 2019. Where as the imports was less than 75% in 2013.
Read 16 tweets
15 Feb
LPG cylinder price in the last 8 Januaries in comparison to the Propane price for the respective period & the Fuel Subsidy budget for the respective financial year. Image
LPG subsidies have been proportional to Propane price projections since 2015.

There is a phenomenal reduction in Price of non subsidised cylinder over these years.
Looking for more details? You might find it here 👇👇
Read 4 tweets
13 Feb
TN receives 157% more share from centre compared to UPA

32 Lakh New consumers cover under PMUY Free LPG cylinders scheme. Total consumers more than 2 Crore now

13 Lakh Tapped Water connections given to Rural Households since Aug’19

#TNWelcomesModi #WelcomeModi
49 Lakh Individual Household Latrines constructed under Swach Bharat mission

48 Lakh Farmers covered under PM Kisan Scheme - ₹6000 per farmer/year.

In 19-20, Loans worth 35,000 Crores given to MSME, Highest in the country

#TNWelcomesModi #WelcomeModi
₹2221 Lakhs (100% High than UPA2) worth Grants Issued in 5 years by to Coir Entrepreneurs

1735 Kms National Highway laid in the last 5 years

6 Lakh Crore spent by central government in TN since 2014

#TNWelcomesModi #WelcomeModi
Read 6 tweets
5 Feb
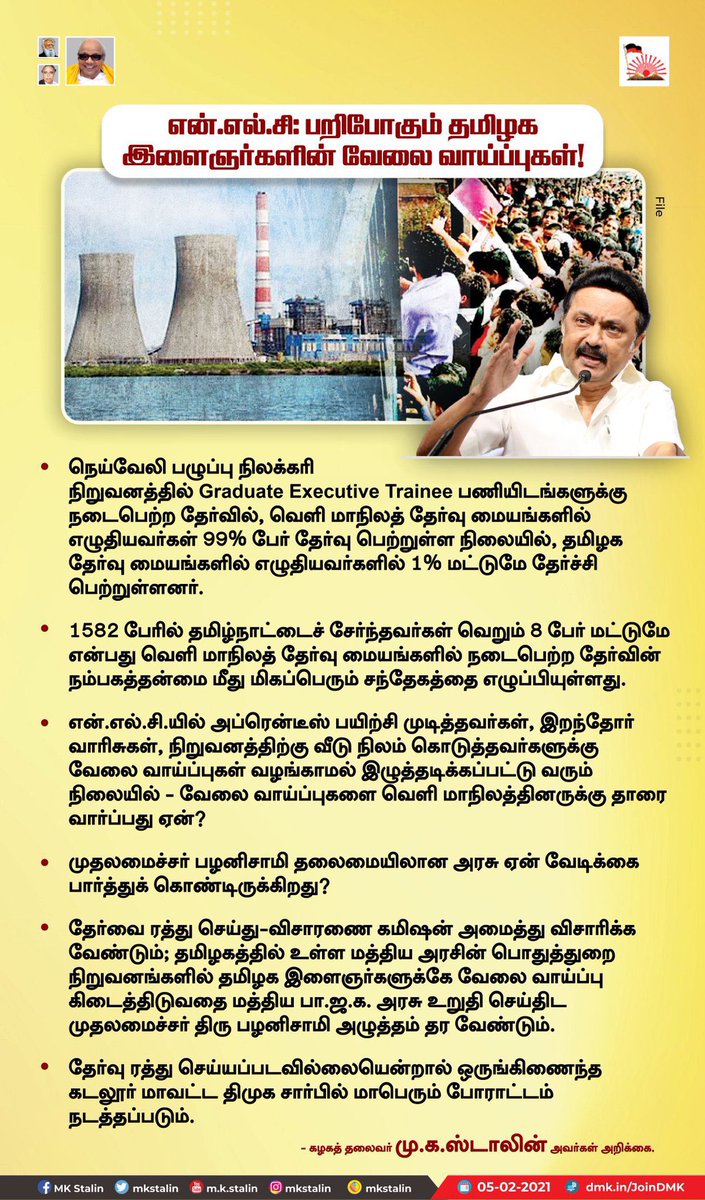
DMK has put out this poster. It says the students who passed the NLC written exams for GET position from TN is 1% viz a viz 99% from other states

They’ve demanded an enquiry commission for this. If they have the data of how it is just 1% from TN, why do you need the commission?
Firstly this recruitment is not only NLC plants in Neyveli & Tuticorin; But also for their plants situated in Barsingar, Bithnok, Talabira, South Pachwara and Ghatampur.

The 1980MW plant in Ghatampur, UP will be commissioned later this year and will be put to operation.
NLC had recently commenced its coal mining operations in NLC Talabira Project in Odisha. The Total capacity of mining is 23 Million Tones per Annum.

The total capacity of Mines in Neyveli is 28 Million Tones Per Annum.
Read 12 tweets
3 Feb
PC comparing Defence expenditure of last and current year; But he wouldn’t say what was current year’s budget and the actual expenditure

Expenditure from Revenue Account

2019-20 : ₹2,15,297 Cr
2020-21 BE : ₹2,18,368 Cr
2020-21 RE : ₹2,19,676 Cr
2021-22 BE : ₹2,20,707 Cr
Expenditure from Capital Account

2019-20 : ₹1,11,092 Cr
2020-21 BE : ₹1,13,734 Cr
2020-21 RE : ₹1,34,510 Cr
2021-22 BE : ₹1,35,070 Cr

Total Expenditure

2019-20 : ₹3,26,389 Cr
2020-21 BE : ₹3,32,102 Cr
2020-21 RE : ₹3,54,186 Cr
2021-22 BE : ₹3,55,577 Cr
In 2020-21 GOI spent ₹27,797 Crores & 8.5% higher than 2019-20.

7% more than the Budget estimates for the year 2020-21.

This is excluding the pensions every year for defence services.

indiabudget.gov.in/doc/AFS/allafs…
Read 5 tweets
1 Feb
Disinvestments : Sale of Partial stake also qualifies under disinvestment

Department of Disinvestment was brought under ministry of finance in May 2004 immediately after UPA Government took over.

Inflation adjusted value of disinvestment over the past 👇👇
2009-10 : ₹46,981 Cr
2010 -11 : ₹40,352 Cr
2011 -12 : ₹23,776 Cr
2012 -13: ₹36,876 Cr
2013 -14: ₹22,385 Cr

UPA 2: ₹1,70,370 Crores

2014-15 : ₹32,443 Cr
2015-16 : ₹23,997 Cr
2016-17 : ₹46,247 Cr
2017-18 : ₹1,00,057 Cr
2018-19 : ₹84,972 Cr

NDA 1: ₹2,87,716 Crores
2017-18 recorded the highest disinvestment. Of the ₹1,00,057 Cr disinvested, ONGC got ₹36,915 Cr of Government stake in HPCL.

Even in 2018-19, ₹15,000 Cr disinvestment happened by virtue of Power finance corporation buying out major stake in Rural electrification corporation
Read 4 tweets

Did Thread Reader help you today?

Support us! We are indie developers!


This site is made by just two indie developers on a laptop doing marketing, support and development! Read more about the story.

Become a Premium Member ($3/month or $30/year) and get exclusive features!

Become Premium

Too expensive? Make a small donation by buying us coffee ($5) or help with server cost ($10)

Donate via Paypal Become our Patreon

Thank you for your support!

Follow Us on Twitter!