Our daily update is published. States reported 1.6 million tests, 65k cases, 44,172 currently hospitalized COVID-19 patients, and 1,743 deaths. Four bar charts showing key COVID-19 metrics for the US over
Today’s update includes 31k previously unreported tests in MN and 2125 previously unreported cases in TX.
A month ago, the number of deaths reported was more than twice what it is today. Chart showing the number of deaths reported each Thursday fo
The number of people hospitalized with COVID-19 per million has decreased over the past month. 4 states currently have more than 200 people hospitalized per million, while on Feb 4 more than half of states did. Many states decreased their hospitalizations by more more than half. Maps showing the number of people hospitalized per million r
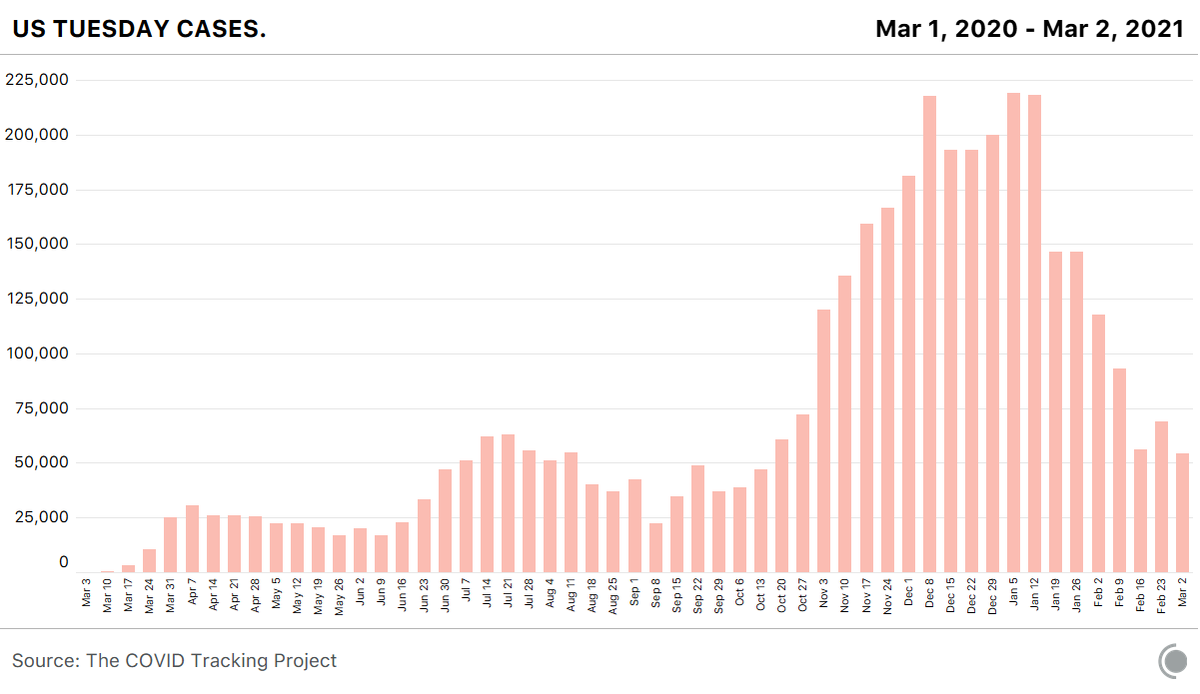
The number of new cases, people hospitalized, and deaths have fallen precipitously since earlier in 2021. Four chart showing the daily tests, cases, people currently

• • •

Missing some Tweet in this thread? You can try to force a refresh
 

Keep Current with The COVID Tracking Project

The COVID Tracking Project Profile picture

Stay in touch and get notified when new unrolls are available from this author!

Read all threads

This Thread may be Removed Anytime!

PDF

Twitter may remove this content at anytime! Save it as PDF for later use!

Try unrolling a thread yourself!

how to unroll video
  1. Follow @ThreadReaderApp to mention us!

  2. From a Twitter thread mention us with a keyword "unroll"
@threadreaderapp unroll

Practice here first or read more on our help page!

More from @COVID19Tracking

5 Mar
Since The COVID Tracking Project is winding down on March 7, we’re packaging up what we’ve learned about federal COVID-19 data in a 101 series. Up today: federal testing data. covidtracking.com/analysis-updat…
Unlike case, death, and hospitalization data, federal testing data doesn’t match well to the state data we collect. The discrepancies point to problems with both state and federal data sources. Our deep dive on that: covidtracking.com/analysis-updat…
Thankfully, federal testing data is standardized, unlike our patchwork testing dataset. But the data can be incomplete—especially in 5 states that still can’t submit data to the federal government: A flowchart shows the path of testing data from laboratories
Read 4 tweets
5 Mar
For our API users: Yesterday, we switched totalTestResults to use values from totalTestsViral instead of being calculated from positive+negative in 4 states: IL, ME, MI, and SD.
These switches caused the totalTestResults field to increase by ~325k (cumulatively). The increases were driven by MI and SD, because our old totalTestResults counted MI positives and SD positives and negatives in units of unique people instead of specimens.
To get more testing history, we changed ME’s testing data source to one that counts residents only instead of residents and nonresidents. ME’s other COVID-19 data only counts residents, so the new source better matches the rest.
Read 5 tweets
4 Mar
Today we published our final weekly update. COVID-19 cases, deaths, and hospitalizations continue to decline, while tests are up 12 percent. covidtracking.com/analysis-updat… 4 bar charts showing weekly COVID-19 metrics for the US. Cas
Although holiday and storm-related reporting disruptions appear to have affected reported cases, tests, and deaths in recent weeks, the data does not currently suggest that case or death declines are reversing. Bar chart from Nov 1, 2020 - Mar 3, 2021 showing the daily p
The sustained decline in cases and hospitalizations is very encouraging, but with multiple variants of SARS-CoV-2 gaining footholds in US cities, it remains vitally important to further reduce the virus’s spread via masking, social distancing, and avoiding indoor gatherings.
Read 7 tweets
4 Mar
Our daily update is published. States reported 1.4 million tests, 67k cases, 45,462 currently hospitalized COVID-19 patients, and 2,449 deaths. 4 bar charts showing key CO...
The number of people currently hospitalized with COVID-19 has dropped dramatically since the start of the year. Each day, the total drops by about 2%. bar chart showing the daily...
VA is still reconciling death certificates from the post holiday surge. As a result, their death count is artificially inflated. Nationally, deaths are still declining.  4 daily bar charts with 7-...
Read 5 tweets
3 Mar
Our daily update is published. States reported 1.3 million tests, 54k cases, 46,388 currently hospitalized COVID-19 patients, and 1,885 deaths. 4 bar charts showing key CO...
Zooming in... Two weeks ago, storm-related outages drove down case reporting. Last week, those cases filled in and sent the average higher. Now, a full two weeks later, the numbers seem to be settling out. 4 bar charts showing tests,...
Cases vary by day of the week. This is the fewest number of cases reported on a Tuesday since October 13. A bar chart of the number o...
Read 5 tweets
2 Mar
Our daily update is published. States reported 1.2M tests, 48k cases, 46,738 currently hospitalized, and 1,241 COVID-19 deaths. 4 bar charts showing key COVID-19 metrics for the US over ti
For the first time since Oct 18, the number of new COVID-19 cases is below 50k. Chart showing 7-day average for daily reported COVID-19 case
The 7-day average for COVID-19 testing is increasing after a sharp dip in February. Chart showing 7-day average for daily reported COVID-19 test
Read 7 tweets

Did Thread Reader help you today?

Support us! We are indie developers!


This site is made by just two indie developers on a laptop doing marketing, support and development! Read more about the story.

Become a Premium Member ($3/month or $30/year) and get exclusive features!

Become Premium

Too expensive? Make a small donation by buying us coffee ($5) or help with server cost ($10)

Donate via Paypal Become our Patreon

Thank you for your support!

Follow Us on Twitter!