
Steve Nison - Japanese Candlestick Charting Techniques📕📗
An educational thread 🧵on #Candlestick from the book which I read and my understanding.✏️✏️
Add Additional points for learning purpose.
#nitishvanaparthi
#NV1learning
@caniravkaria Sir, small effort from my end
(1/n)
An educational thread 🧵on #Candlestick from the book which I read and my understanding.✏️✏️
Add Additional points for learning purpose.
#nitishvanaparthi
#NV1learning
@caniravkaria Sir, small effort from my end
(1/n)

Below are the topics covered in this thread
1. Candlestick Details
2. Strong Buyers
3. Weak Buyers
4. Single Candlestick pattern
5. Two Candlestick Pattern
6. Three Candlestick Pattern
7.Doji
(2/n)
1. Candlestick Details
2. Strong Buyers
3. Weak Buyers
4. Single Candlestick pattern
5. Two Candlestick Pattern
6. Three Candlestick Pattern
7.Doji
(2/n)
1. Candlestick Details : Candles are created by up and down movements in the price
Bullish Candlestick
Bearish Candlestick
(3/n)
Bullish Candlestick
Bearish Candlestick
(3/n)
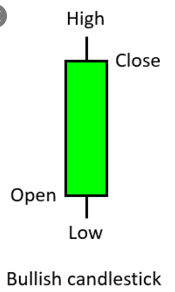

2. Strong Buyers : Where the color of the body is green and length of the body is above the average and having
a small wick at upper side
(4/n)
a small wick at upper side
(4/n)

3. Weak Buyers
In this case color of the body is green and a very long upper wick. Body will be relatively small when compared to wick.
It is quite opposite in the case of Strong sellers and weak sellers
(5/n)
In this case color of the body is green and a very long upper wick. Body will be relatively small when compared to wick.
It is quite opposite in the case of Strong sellers and weak sellers
(5/n)

4. Single Candlestick Pattern
a. Hammer : This will have a small body with long lower wick
This will indicate a potential price reversal towards upside.
It indicates that price has reached the bottom.
Color of the candle can either be Green or red.
(6/n)
a. Hammer : This will have a small body with long lower wick
This will indicate a potential price reversal towards upside.
It indicates that price has reached the bottom.
Color of the candle can either be Green or red.
(6/n)

b. Hanging Man
This can be seen in an uptrend and warns that price may start fall.
This candle will have a small candle with long lower wick
Color of candle can either be Green or red
(7/n)
This can be seen in an uptrend and warns that price may start fall.
This candle will have a small candle with long lower wick
Color of candle can either be Green or red
(7/n)

C. Inverted Hammer
This pattern will be seen at bottom of the downtrends.
Considered as bullish reversal pattern
Color of the candle doesn't matter.
(8/n)
This pattern will be seen at bottom of the downtrends.
Considered as bullish reversal pattern
Color of the candle doesn't matter.
(8/n)

d. Shooting star
It looks exactly the same as the Inverted hammer, but instead of being found in a downtrend it is found in an uptrend
(9/n)
It looks exactly the same as the Inverted hammer, but instead of being found in a downtrend it is found in an uptrend
(9/n)

5. Two Candlestick Pattern
a. Bullish Engulfing
Look for a 2 candles in a downward trend. First is a Red candle followed by a taller Green candle.
Green candle should have close above previous open and open below previous close
(10/n)
a. Bullish Engulfing
Look for a 2 candles in a downward trend. First is a Red candle followed by a taller Green candle.
Green candle should have close above previous open and open below previous close
(10/n)

b. Bearish Engulfing
Look for a 2 candles in a up trend. First is a white candle followed by a taller black candle.
Red candle should have close above previous open and open below previous close
(11/n)
Look for a 2 candles in a up trend. First is a white candle followed by a taller black candle.
Red candle should have close above previous open and open below previous close
(11/n)

c. Bullish Harami
Look for tall red candle in a downward price trend. Next candle should be green one within the red candle.
The tops or bottoms of the bodies can be same price but not both
(12/n)
Look for tall red candle in a downward price trend. Next candle should be green one within the red candle.
The tops or bottoms of the bodies can be same price but not both
(12/n)

d. Bearish Harami
Look for tall Green candle in an upward price trend. Next candle should be red one within the green candle.
The tops or bottoms of the bodies can be same price but not both
(13/n)
Look for tall Green candle in an upward price trend. Next candle should be red one within the green candle.
The tops or bottoms of the bodies can be same price but not both
(13/n)

e. Dark cloud cover
It is a bearish reversal signal pattern. It is observed after an upward trend.
(14/n)
It is a bearish reversal signal pattern. It is observed after an upward trend.
(14/n)

f. Piercing Pattern
It is a bullish reversal signal pattern. It is observed after a downward trend.
(15/n)
It is a bullish reversal signal pattern. It is observed after a downward trend.
(15/n)

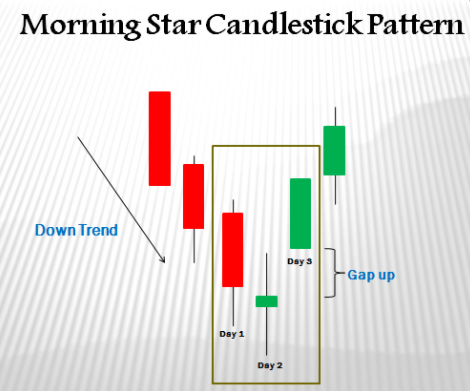
6. Three Candlestick Pattern
a. Morning Star
It is a pattern interpreted as bullish sign. It is a sign of a reversal in price trend.
(16/n)
a. Morning Star
It is a pattern interpreted as bullish sign. It is a sign of a reversal in price trend.
(16/n)
b. Evening Star
It is a pattern interpreted as bearish sign. It is a sign of a reversal in price trend.
it is associated with top of price uptrend.
(17/n)
It is a pattern interpreted as bearish sign. It is a sign of a reversal in price trend.
it is associated with top of price uptrend.
(17/n)

7.Doji
a. Dragonfly Doji :
(18/n)
a. Dragonfly Doji :
(18/n)


b. Gravestone Doji
(19/n)
(19/n)


After reading if you feel it as worth then retweet for benefit of others. For learning purpose you can add your comments as well.
(20/n)
(20/n)
• • •
Missing some Tweet in this thread? You can try to
force a refresh


