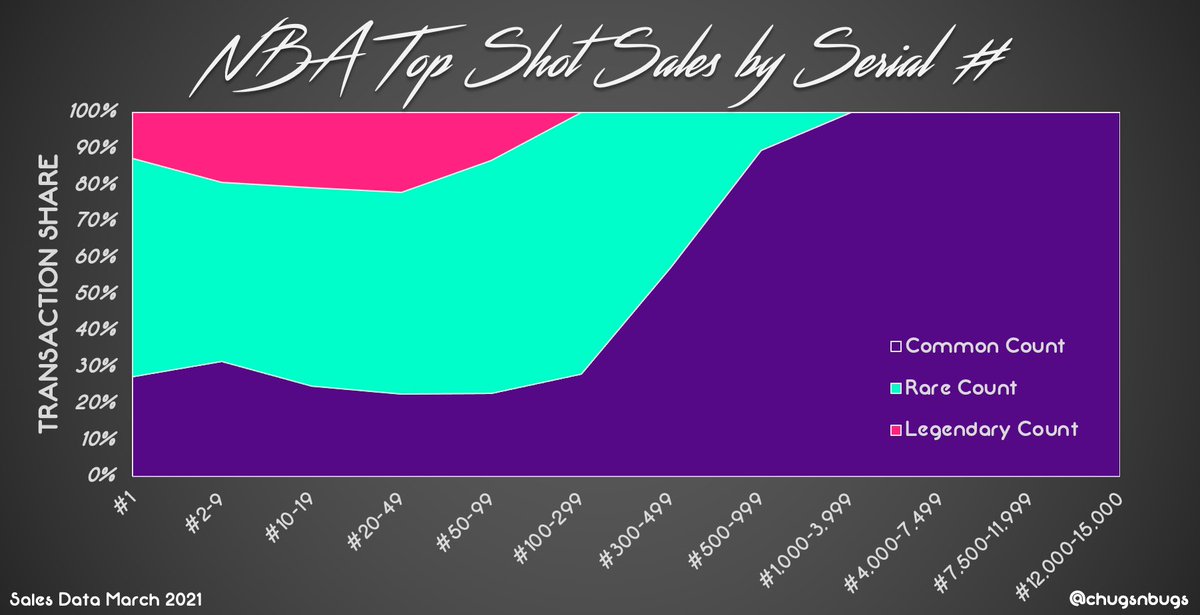
🎨 #nightmode #fingerpainting 😎
*Will incorporate the new 35k moments next time*
🔸Common 7500-15000 biggest % discount to curve 👍🏼
🔸Common 300-999 biggest % premium to curve 👎🏼
🔸Common 1 has really caught up to 1 Rares 👀
🔸Legendary 2-9 still looks prettyy prettyy good 😏
*Will incorporate the new 35k moments next time*
🔸Common 7500-15000 biggest % discount to curve 👍🏼
🔸Common 300-999 biggest % premium to curve 👎🏼
🔸Common 1 has really caught up to 1 Rares 👀
🔸Legendary 2-9 still looks prettyy prettyy good 😏

Rising Stars likely the reason for a swell of Rare activity - last update Commons were accounting for at least ~50% of activity even in the lowest serial buckets. 

Understand this is a VERY broad look at the market looking strictly at what has actually gotten sold.
Hopefully this can help you know where the goalposts are in general, but understand every player/moment has its own unique valuation. 🤨
Hopefully this can help you know where the goalposts are in general, but understand every player/moment has its own unique valuation. 🤨
A quick note on Jersey match - 19 trades so far this month:
10 Commons ➡️ Avg 9.8k (5x SS, 3x S1 Base, 2x S2 Base)
8 Rares ➡️ Avg 5.9k (7x from RS)
1 Legendary ➡️ 15k (Marcus Smart Icon)
Last but not least, s/o @EvaluateMarket for data 🤛🏼
10 Commons ➡️ Avg 9.8k (5x SS, 3x S1 Base, 2x S2 Base)
8 Rares ➡️ Avg 5.9k (7x from RS)
1 Legendary ➡️ 15k (Marcus Smart Icon)
Last but not least, s/o @EvaluateMarket for data 🤛🏼
• • •
Missing some Tweet in this thread? You can try to
force a refresh


