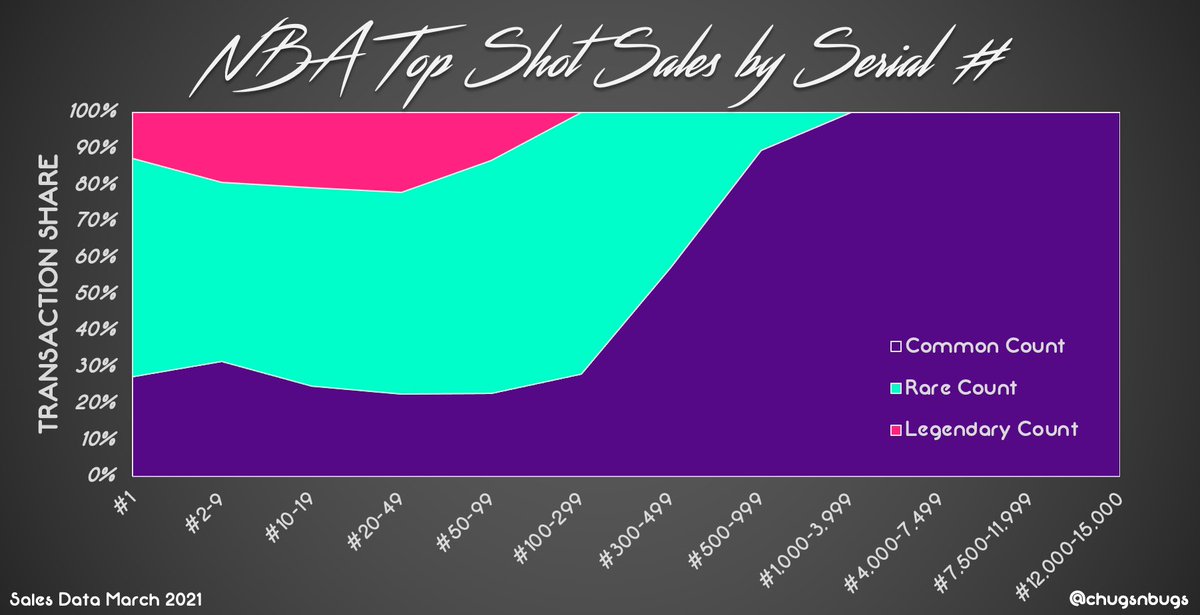
🎨 #fingerpainting 🎨
So do we ACTUALLY value scarcity at an increasing rate just like quality?
Ex-critical SNs, we certainly pay higher prices for lower counts… This is probably not a surprise to anyone.
[Maxes not shown]
1-100 ⬆️ ~73k
101-500 ⬆️ ~40k
501-1000 ⬆️ ~37k
So do we ACTUALLY value scarcity at an increasing rate just like quality?
Ex-critical SNs, we certainly pay higher prices for lower counts… This is probably not a surprise to anyone.
[Maxes not shown]
1-100 ⬆️ ~73k
101-500 ⬆️ ~40k
501-1000 ⬆️ ~37k

Let’s strip the buckets just for fun… This time the maxes are shown 🚀
Look close 🔎 every single mint count size that’s traded this month is in there.
So wtf good does this do? Well, let’s look at the same comparison but by Implied Cap instead of just Sales Price…
Look close 🔎 every single mint count size that’s traded this month is in there.
So wtf good does this do? Well, let’s look at the same comparison but by Implied Cap instead of just Sales Price…

Wait what?! LOWER mint count = LOWER overall valuation?!
In theory, this orange line SHOULD at best be sloping up from right to left, or basically flat at worst. Alas, we have higher valuations on common moments vs some of the most scarce moments in all of @nba_topshot 🤦🏻♂️
In theory, this orange line SHOULD at best be sloping up from right to left, or basically flat at worst. Alas, we have higher valuations on common moments vs some of the most scarce moments in all of @nba_topshot 🤦🏻♂️

One more time with feeling… the whole enchilada by Implied Cap. Look at some of the valuation ranges shown on literally the most common mint counts in the entire platform 👀 encouraging to see that standouts seem justified at least… 

So what does this mean? It means that sticker shock (price) is actually dictating valuation more than scarcity (mint count). More accessible moments from a dollar price standpoint are getting the most shine because of that very accessibility - liquidity is the rising tide…
So in relative terms, the best deals in @nba_topshot are ACTUALLY the rarest. How is that possible? 2 main things…
1️⃣ Price point itself eliminates many buyers, hurts valuation
2️⃣ Limited access to funds (aka credit card limits) discourages potential buyers, hurts valuation
1️⃣ Price point itself eliminates many buyers, hurts valuation
2️⃣ Limited access to funds (aka credit card limits) discourages potential buyers, hurts valuation
So what’s next?
1️⃣ Current participants realize spending $200 10x ≠ $2000 1x and start aggressively moving “up in scarcity”
2️⃣ New “smart” money floods the system to capitalize on this inefficiency (would happen faster if funding had no limitations)
1️⃣ Current participants realize spending $200 10x ≠ $2000 1x and start aggressively moving “up in scarcity”
2️⃣ New “smart” money floods the system to capitalize on this inefficiency (would happen faster if funding had no limitations)
Can both of those things happen? Absolutely. Which one is more likely? Probably 2️⃣... but more users/capital is generally a good thing… especially if it’s bigger spenders.
Thanks for staying up late with me 😎
#nightmode
S/o @EvaluateMarket for data 📊
Thanks for staying up late with me 😎
#nightmode
S/o @EvaluateMarket for data 📊
One other thing that could create more efficiency would be an ability for negotiated transactions on particularly high value moments. Rather than listing, two parties can engage in an exchange of bids/offers and come to an agreed price, all done “in the open” through @nba_topshot
• • •
Missing some Tweet in this thread? You can try to
force a refresh


