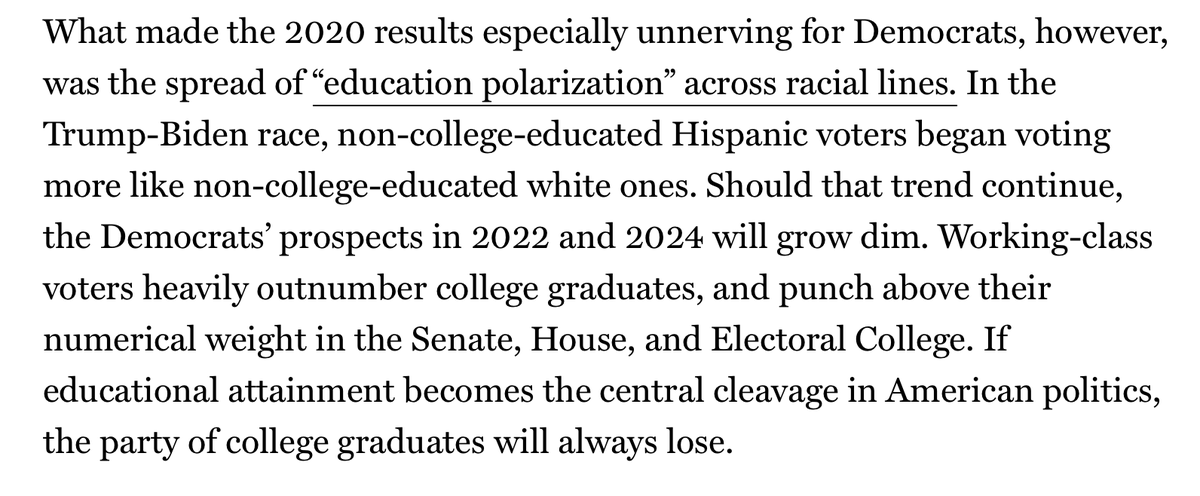
I literally pay for a NYMag subscription just to read @EricLevitz (really!) so am not dunking but truly asking: did I miss the data that enshrined "Hispanic voters polarized by education in 2020" as confirmed fact rather than loose hypothesis? nymag.com/intelligencer/…
It's clear Hispanic voters on aggregate in 2020 voted *more like* non-college non-Hisp white voters & *less like* college educated nHw than they had in 2016: but of course that's not the same as the claim that *among* Hispanc voters it was non-college who swung hardest fr 2016-20
And the specifics of where Hispanic vote shifts (visible everywhere nationally, agreed) were *strongest* are very hard to square w/"educational polarization" as descriptor. So, eg👇, pro-Trump swing esp strong in FL, & esp strong among Vzlans & Colombians nymag.com/intelligencer/…
55% of Venezuelans in the US have college degrees: it is, by far, the highest rate of any Latin American origin group. Colombians are also far above the median: at 33% w/ a bachelors' degree they are just behind Argentines & tied for third w/Panamanians pewresearch.org/fact-tank/2019…
Similarly & relatedly FL has, by far, the Hispanic population with the highest level of college attainment. Were Latino voters polarizing by education the pro-Trump Hispanic swing should have been *weakest* in FL: & stronger (=more pro GOP) in AZ than TX👇 edtrust.org/wp-content/upl…
On separate question of how "socialism!" played see interesting data here👇: again, overall picture is inconsistent with argument that prior beliefs re socialism were somehow antecedent driver (rather than post hoc explanation) of Colombian+broader shift
OK have dug deep into the Pew time machine & partially answered my own Q: yes polling fr 2016 suggests educational polarity among Latino voters reversed in 2020. Interesting! And makes both the GOP FL success story, & the AZ Dem results, even more striking pewresearch.org/hispanic/2016/…
You won't be shocked to hear I think there's a longterm local infrastructure & relational organizing story we need to take on board here...
This Oct 2020 report fr @JaxAlemany on Latino outreach in PA is definitely worth revisiting: incl quote from @MariaTeresa—"Progressives have a tendency to pack their bags and wait until the next cycle", + Matt Schlapp sounding like he's read his Alinsky👇 washingtonpost.com/politics/2020/…
wait whoa this just in from @dhopkins1776 & the plot thickens. Panel data fr 2016-18 shows Hispanic respondents with less education moving *toward* the Democrats in those years, while those w more education shifted toward Republicans 👀
More interesting data incoming on this question. CCES heard from (thanks to @A_agadjanian). If there's a multi cycle trend of educational polarization among Latino voters here, you sure have to squint hard to see it?
This🧵is going to be about PA voter registration trends but let me start here. The thing about our beautiful commonwealth is: it's made up of a bunch of different kinds of places whose politics are being pulled in opposite directions. Start w this map, using @AmcommPro categories
@AmCommPro Teal=Rural. (Fun fact: PA has the 3rd largest rural pop., in absolute terms, in the whole USA!)
Green="Middle Suburbs." Think Rust Belt: aging ex-industrial.
Orange=Urban suburbs: diverse, dense, educated.
Yellow=exurbs: less dense, less diverse, relatively wealthy.
Pink=Big City
@AmCommPro Each of these county-types accounts for a meaningful chunk of population: by 2023 stats, Urban Suburbs are home to 26% of PA's pop; Rural 20% [or ~23% if you add the 2 smaller rural categories to it], MiddleSuburb (=Ex-Industrial) 18%, Exurbs 17%, Big City (=Philadelphia) 12%
to appreciate the scale of Dems' statewide success this wk you have to cast your mind back to the distant past of... Nov 2021, at whch point it looked fully possible the PA electorate would keep speeding rightward twice as fast as it had lurched left after the election of DJTrump
Here's an even clearer metric I ended up with, one that captures turnout shifts as well as vote choice swings: change in net votes by county, averaged across statewide candidates each year to create something close to generic Dem v generic Rep results
In Delco, Montco, Philly & Allegheny Dems had hung on to some anti-Trump era gains, but pretty much everywhere else* across the state—most impactfully in Bucks, SCPA, & the big non-Allegheny counties of SWPA--Republicans were ascendant
It was certainly plausible to think that John Fetterman would have a uniquely strong performance among white working-class or rural Pennsylvanians but... that didn't turn out to be the case at all?🤷♀️
The results are especially striking because surely holding everything equal, one would expect Doug Mastriano's appeal to be strongest in the rural+rust belt areas that swung hard in support of Donald Trump: & Oz to be more appealing in the upscale/moderate/cosmopolitan suburbs?
The darker green counties here are the ones where Shapiro outperformed Fetterman most strongly: which is the same as saying, where Oz outperformed Mastriano most strongly. SCPA/the capitol region, Bucks, but also Cambria, Westmoreland, Butler, Erie🤷♀️
Return of the 2018 Coalition, On Steroids (A Quick Thread on 2022 in Pennsylvania Before this Website Collapses).
tl;dr After Dobbs, the suburbs' anti-Dem realignment screeched to a halt & the anti-Trump realignment returned
Lots of things happened around the end of June: Dobbs, bipartisan bills, gas prices coming down, Jan 6 hearings gaining news. The exact proportions of which had an impact on who may remain up for debate. But what's clear is things changed & stayed changed
The geography of voter reg trend shifts was striking: Dems stopped hemorrhaging voters in PA's "Middle Suburb"/once-industrial counties: & went back to posting 2016-18 style gains in PA's upscale/cosmopolitan "Urban Suburb" counties
This👇is not wrong! But note it's not just a demographic thing. The state & local organizations created/recreated by the anti-Trump grassroots ran through the tape for downballot Dems this year: even while hearing (& believing!) national voices foretelling doom
National voices #onhere have not yet processed what a stunning year this was for downballot Dems in PA. The inverse of 2020, when the presidential result distracted attention from PA Dems' grim downballot slide. PA lived the midterm backlash 2 ys early!💪
Because you are all about to realize you need to know this: in 2021 Democratic PA Supreme Court candidate Maria McLaughlin's share of provisional ballots in both Lehigh & Northampton counties was exactly 20 ppt higher than her share of EDay+Mail votes in each.