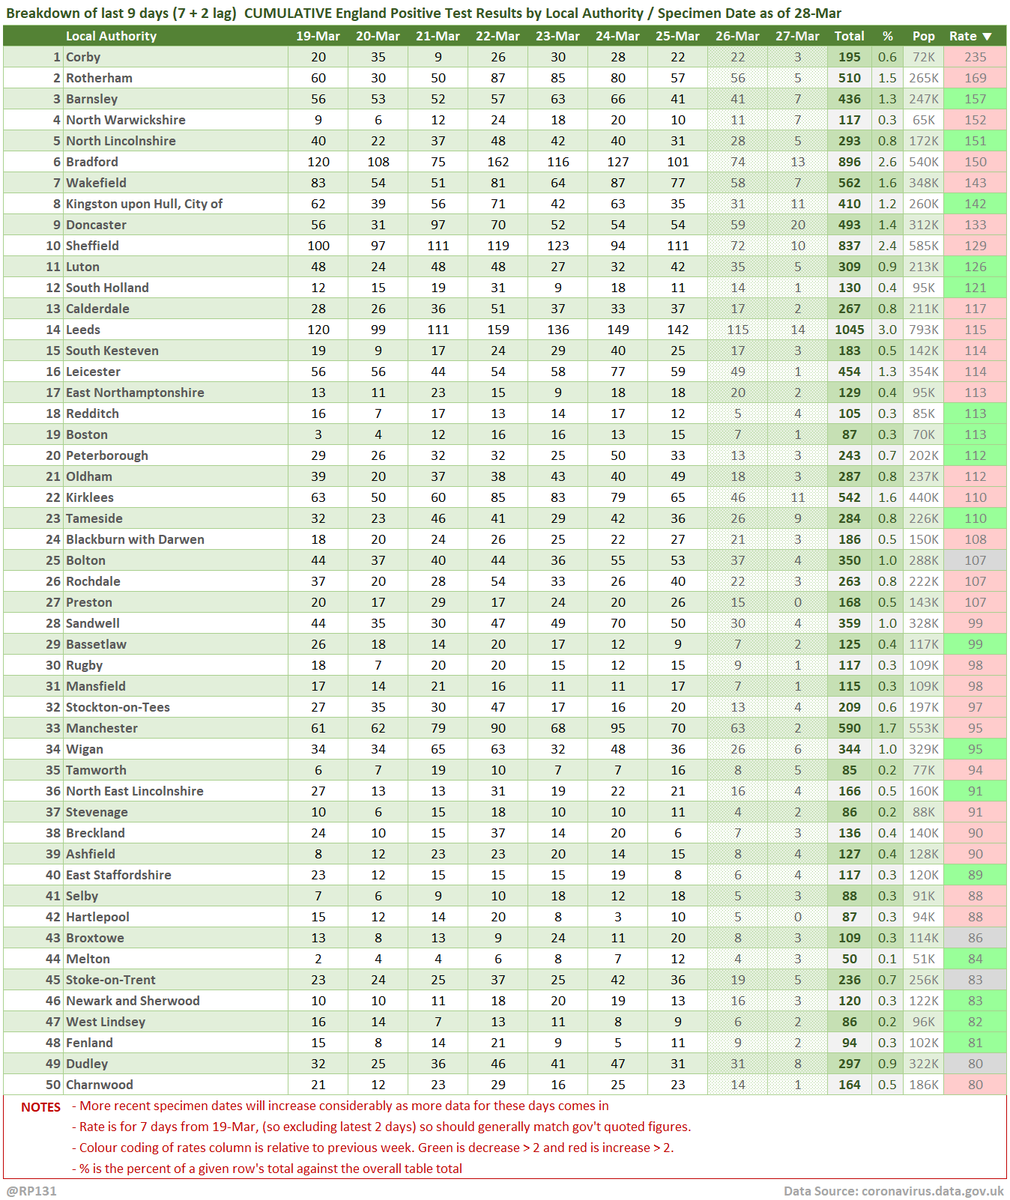
#covid19uk - Tables thread. Re-ordered now to put the more popular rate sorted table at the top. So this is top 50 England Local Authorities by positives per 100K population in last 7 days, up to 3 days ago. Bright green means lower than previous period.
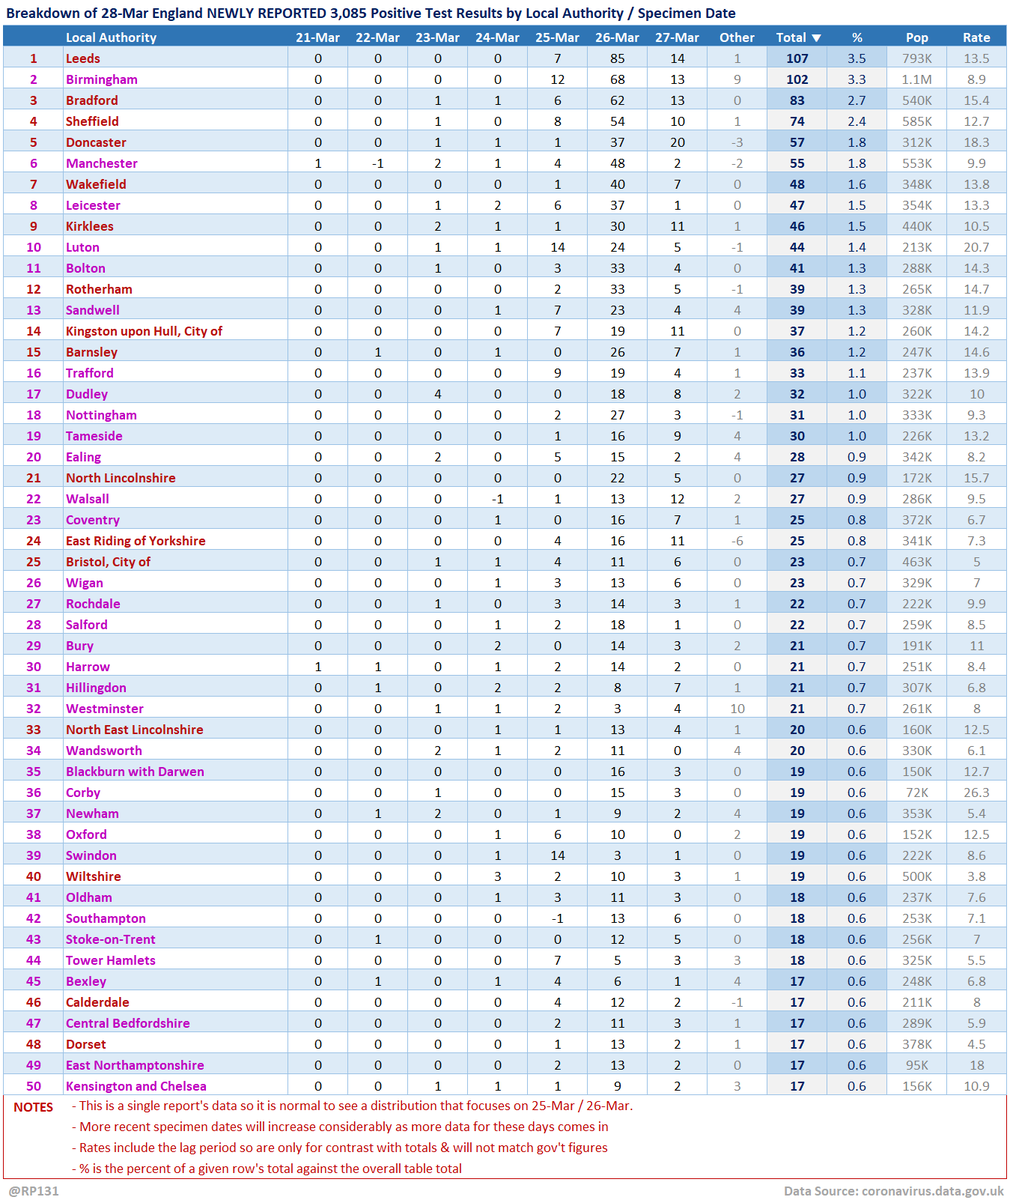
Table view of today's 3,085 NEWLY REPORTED England positive test results by local authority and recent specimen dates. Here showing top 50 authorities which represent 47% of the population, but have 73% of the positives.
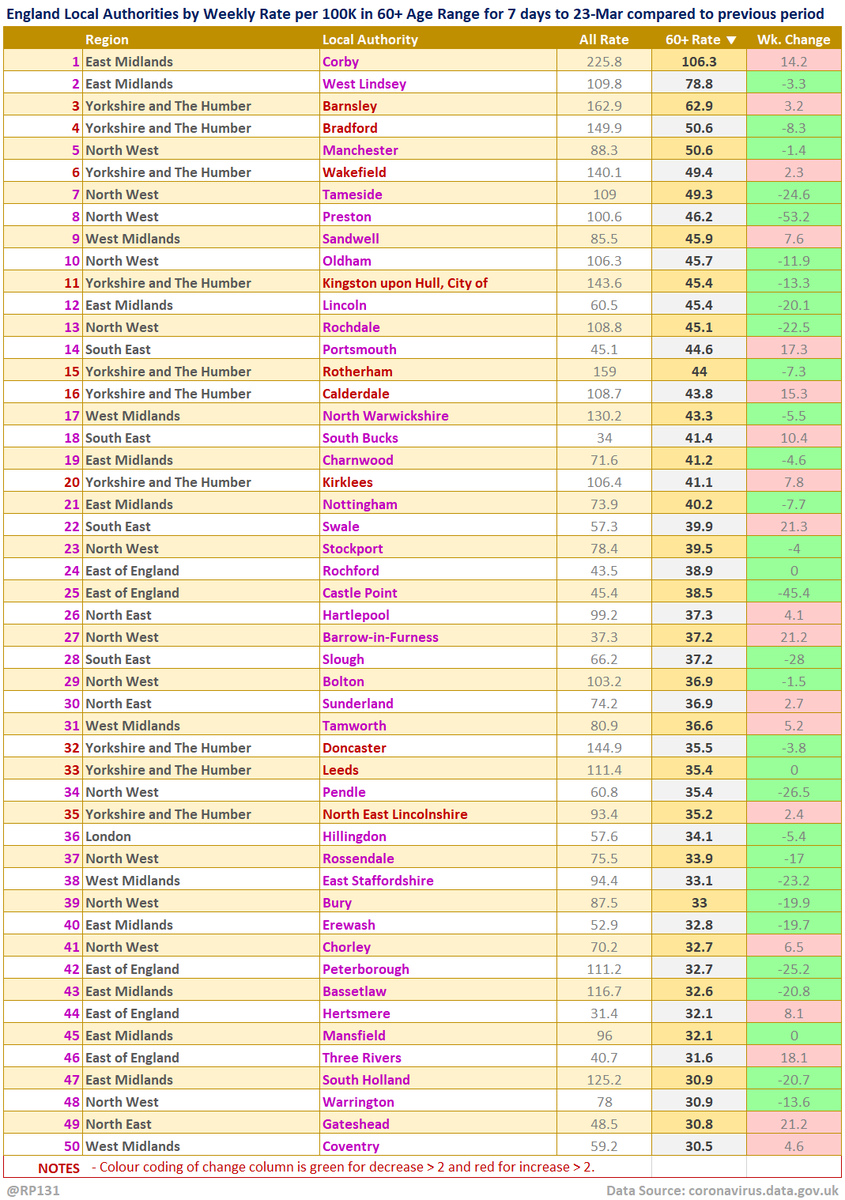
Top 50 table view of latest availble Local Authority data for the 60+ age range for 7 days to 23-Mar sorted by descending rate per 100K population (of that age range). Change column is compared to previous week with red for increase and green for decrease.
Some of the more detailed content from this thread has been moved to an external page to try and make the twitter updates a bit more manageable. You can still see the full version here: …ddatashare.s3-eu-west-1.amazonaws.com/Table/Table_20…
• • •
Missing some Tweet in this thread? You can try to
force a refresh
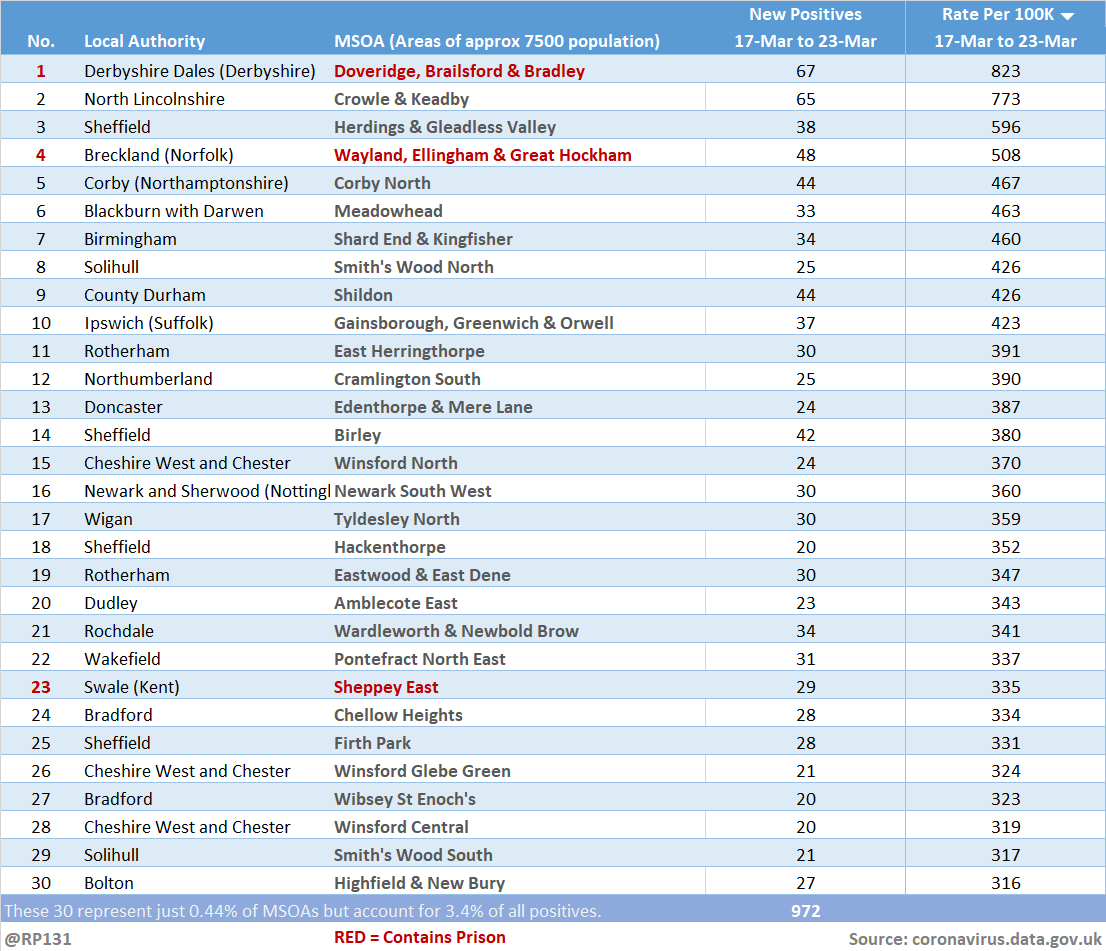
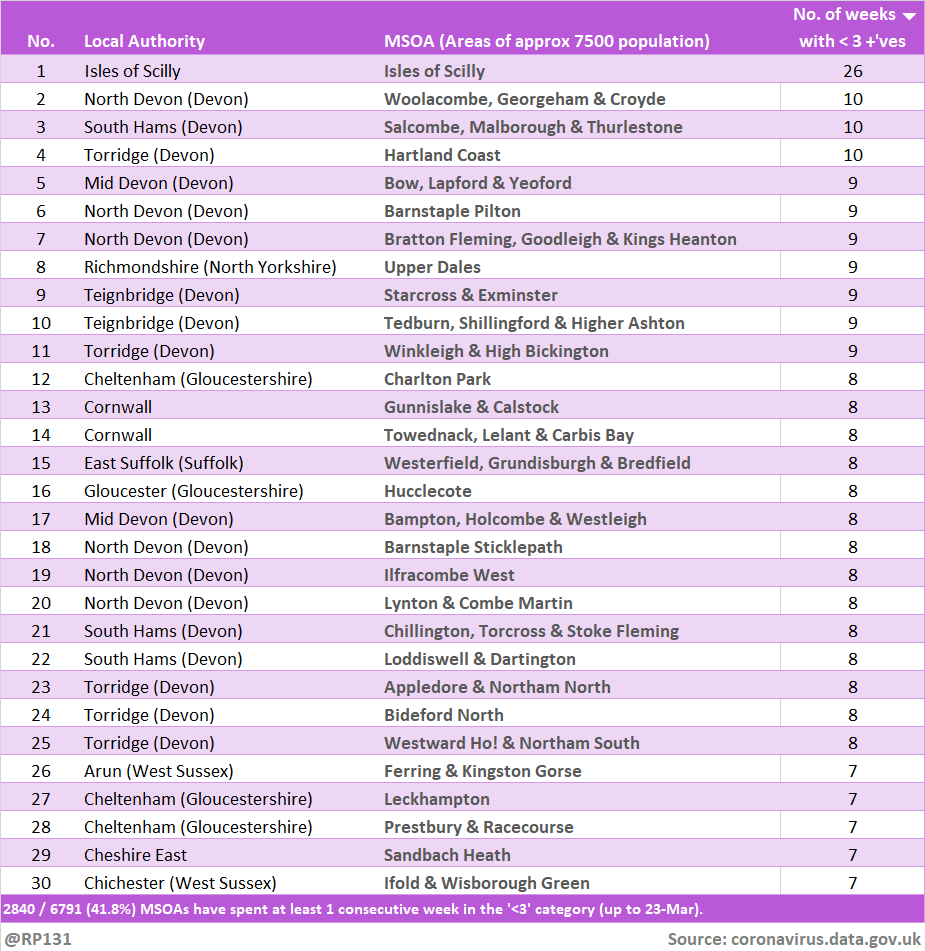
Updated table of top 30 MSOAs (by rate) based on latest numbers in today's report.
Bringing back the view of how many weeks the MSOAs have been in the suppressed 'less then 3 +ves in the last week' category. Since they don't allow us to distinguish between zero / 1 / 2, we generally consider it to mean zero. Link to full table in reply below.
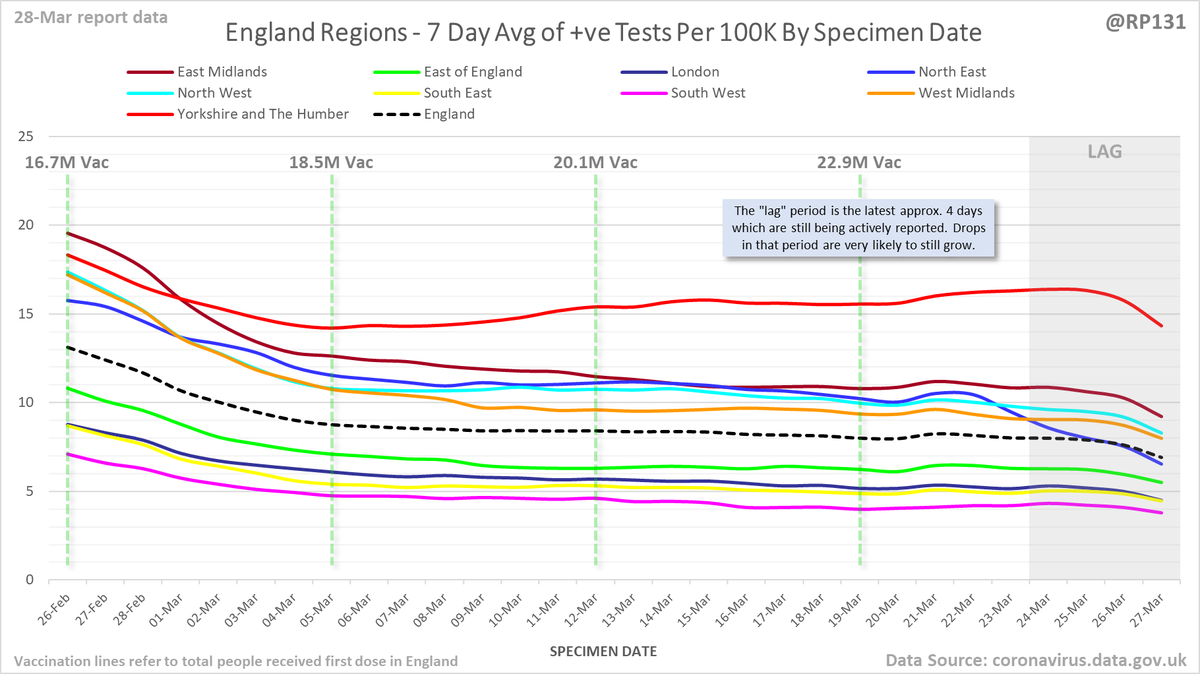
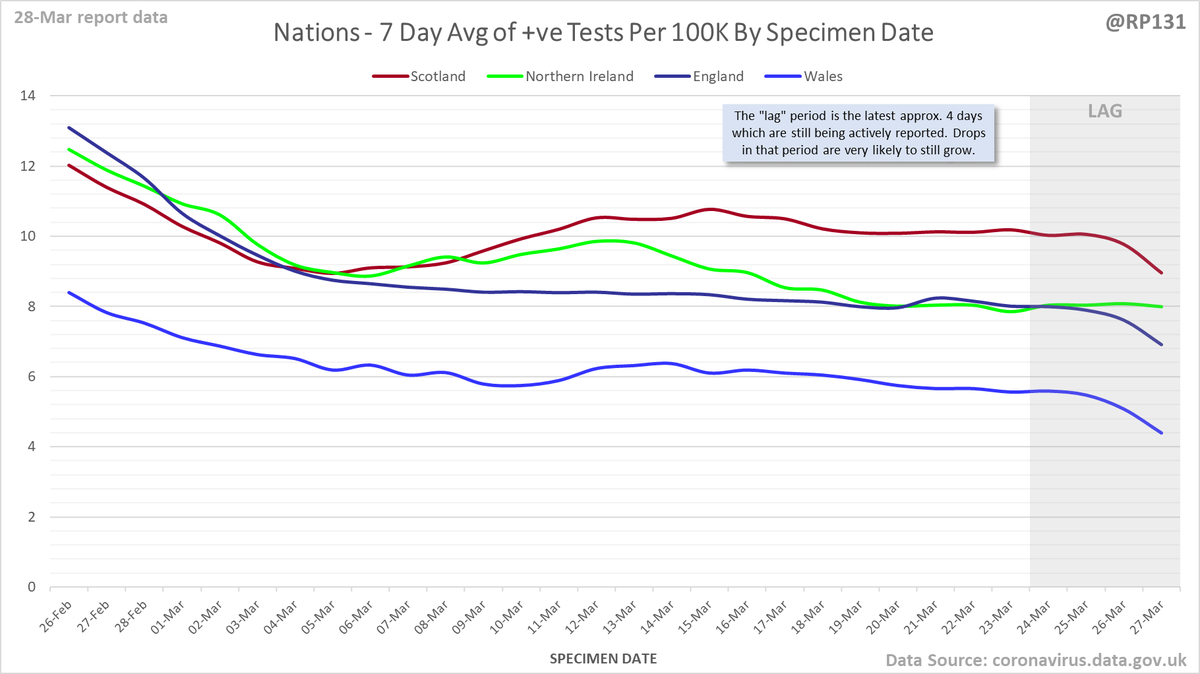
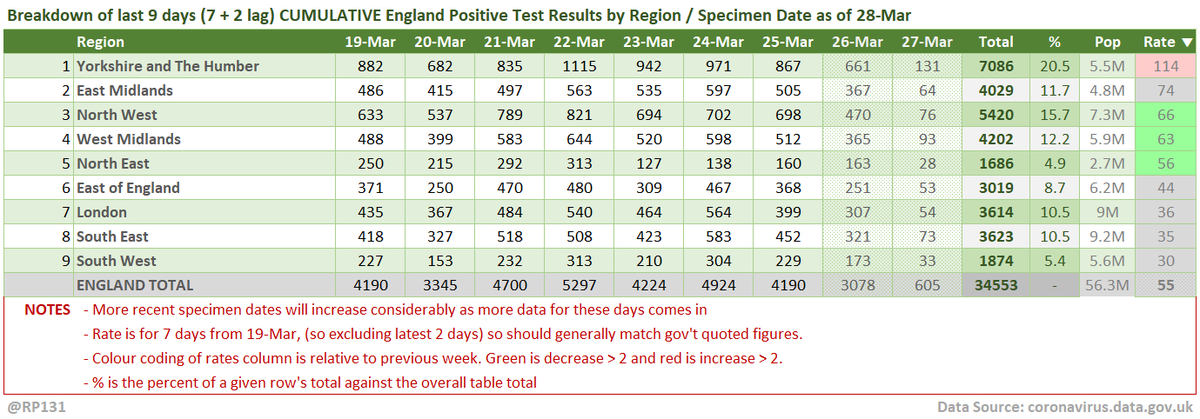
#covid19uk - Detailed positive tests thread. The majority of this thread is a set of views of rolling 7 day average positives per 100K by specimen date. Starting with England regions:
Some of the more detailed content from this thread has been moved to an external page to try and make the twitter updates a bit more manageable. You can still see the full version here: …ddatashare.s3-eu-west-1.amazonaws.com/Detail/Detail_…
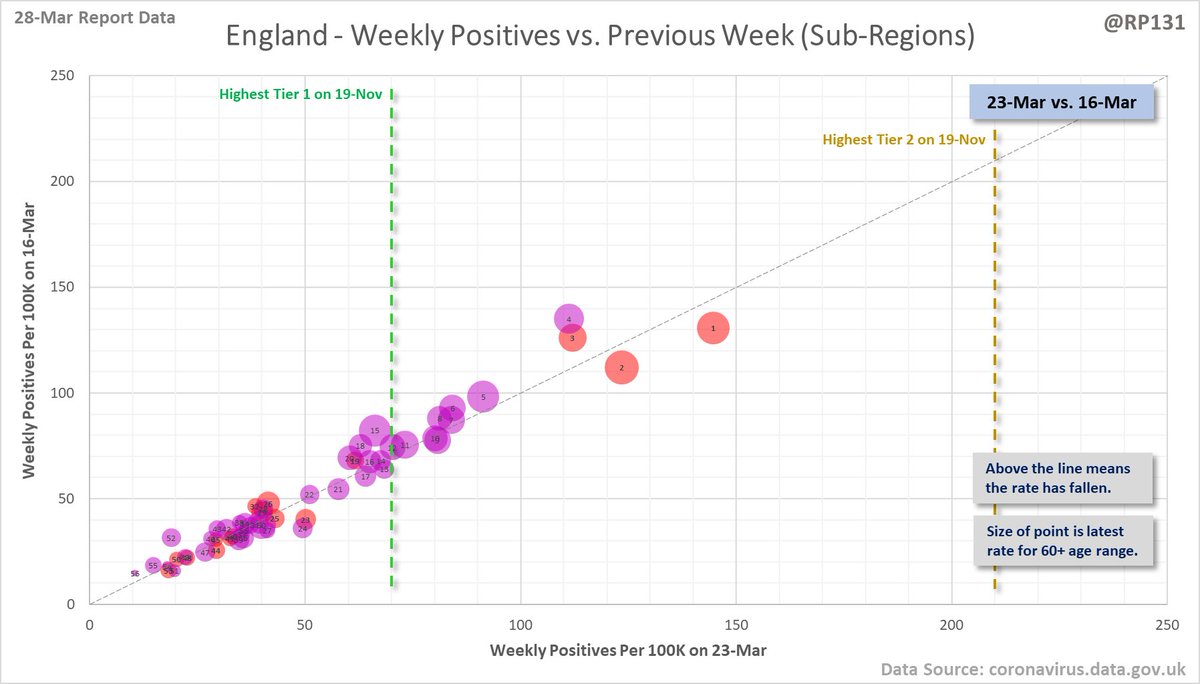
Bubble chart (Tiers / Sub-region) thread. This type of chart allows us to compare week on week changes by seeing if the points are above or below the dotted line. This version is grouped by "sub-regions" as were previously used for assigning tiers:
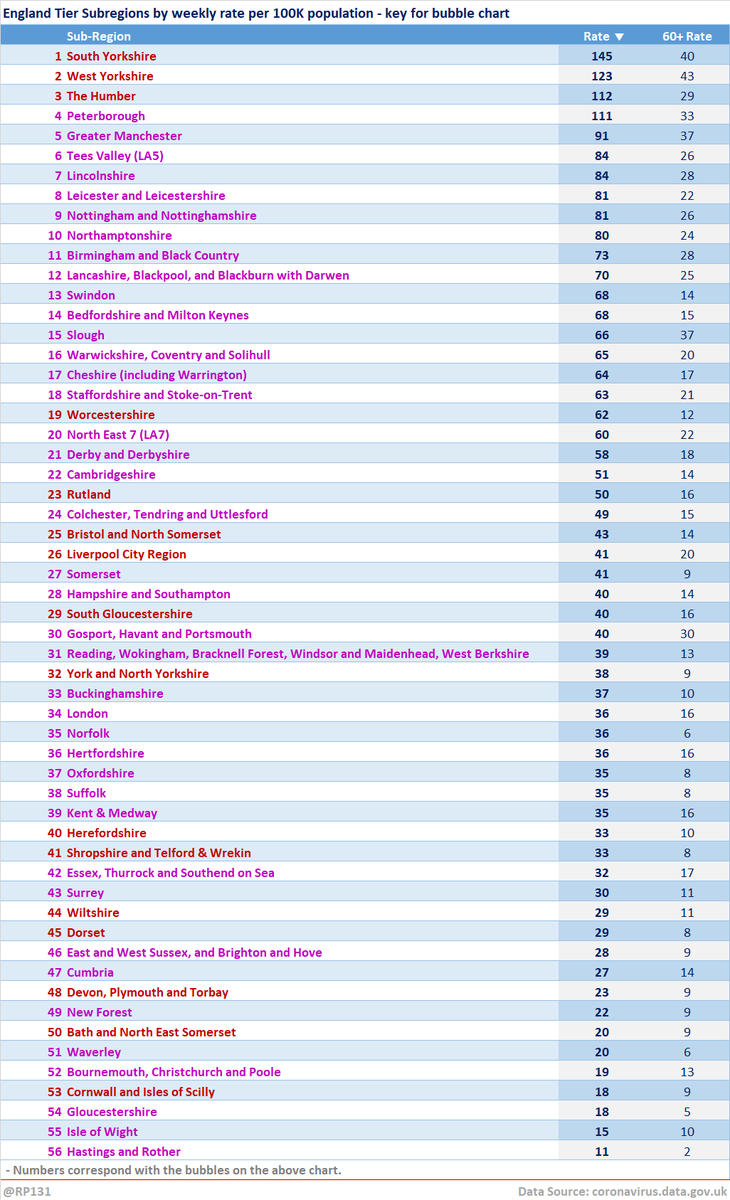
Table of sub-regions to act as key for the numbers on the above chart.
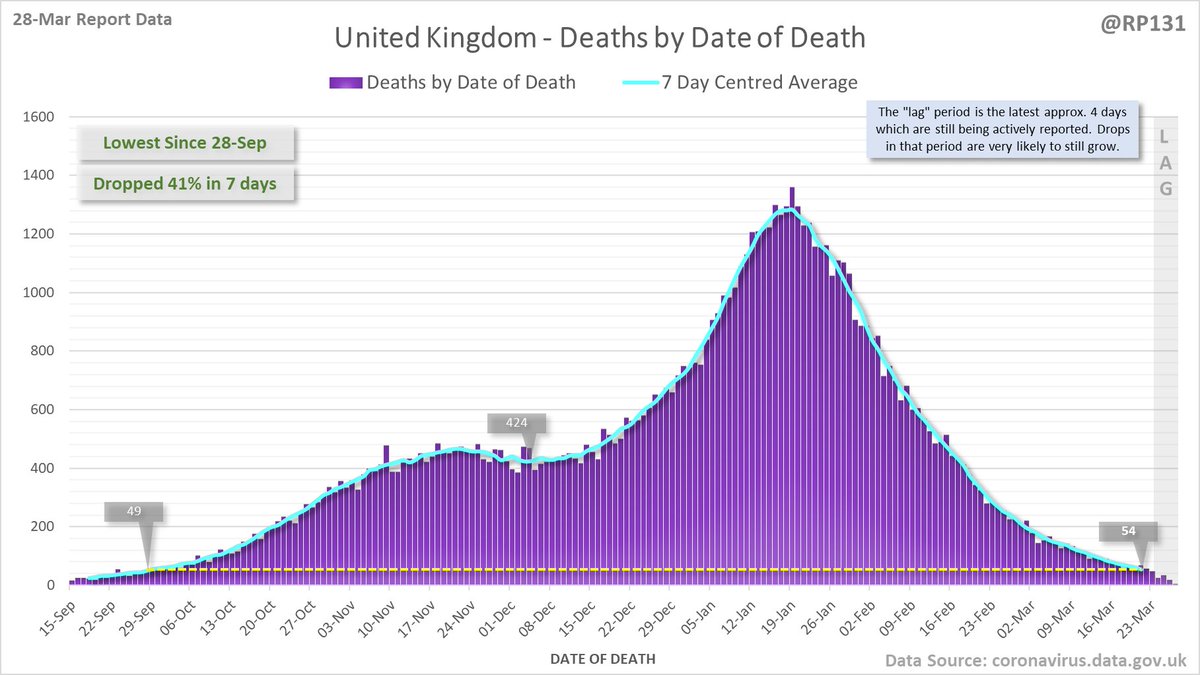
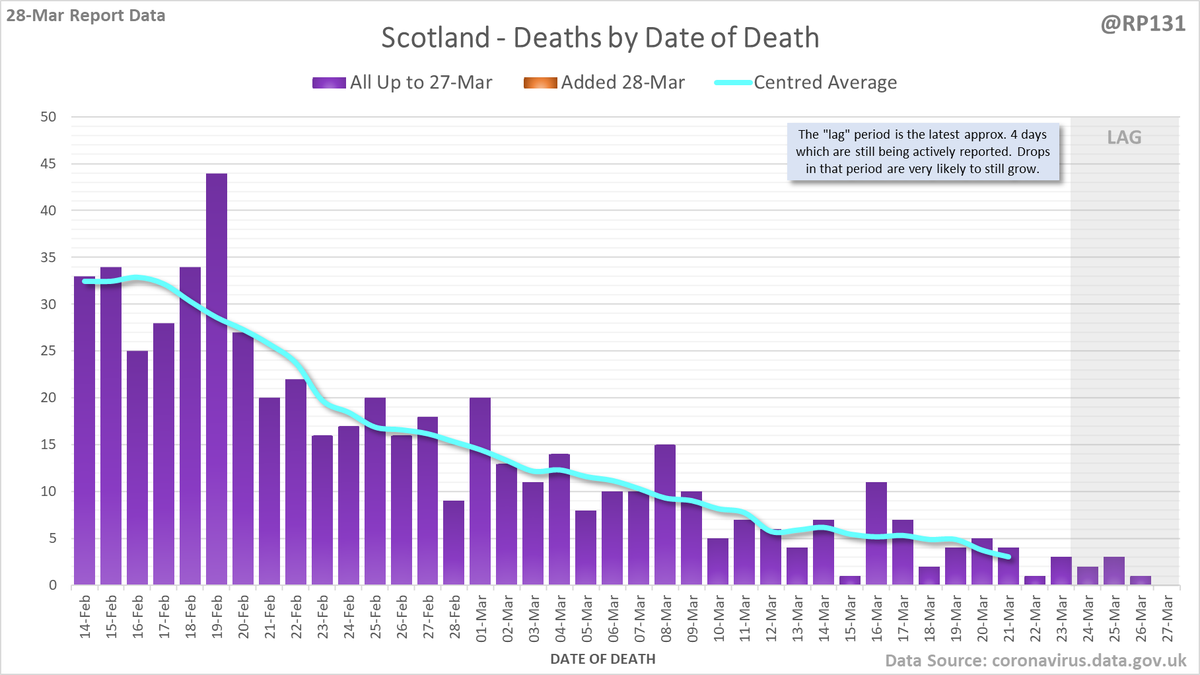
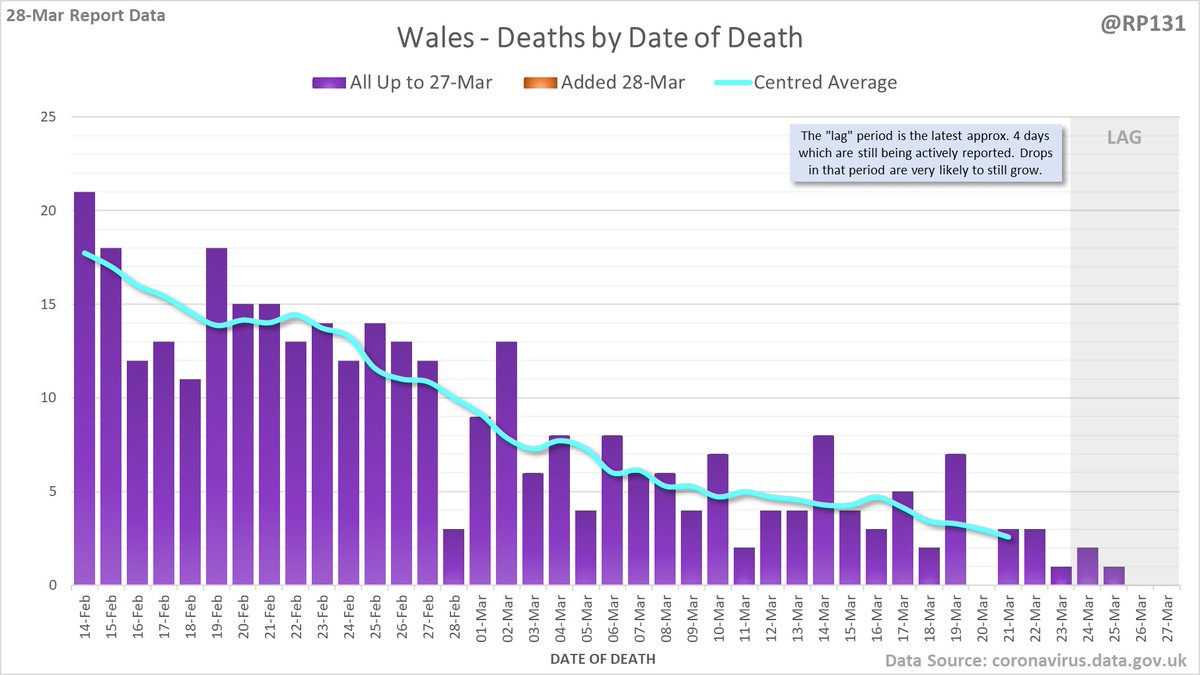
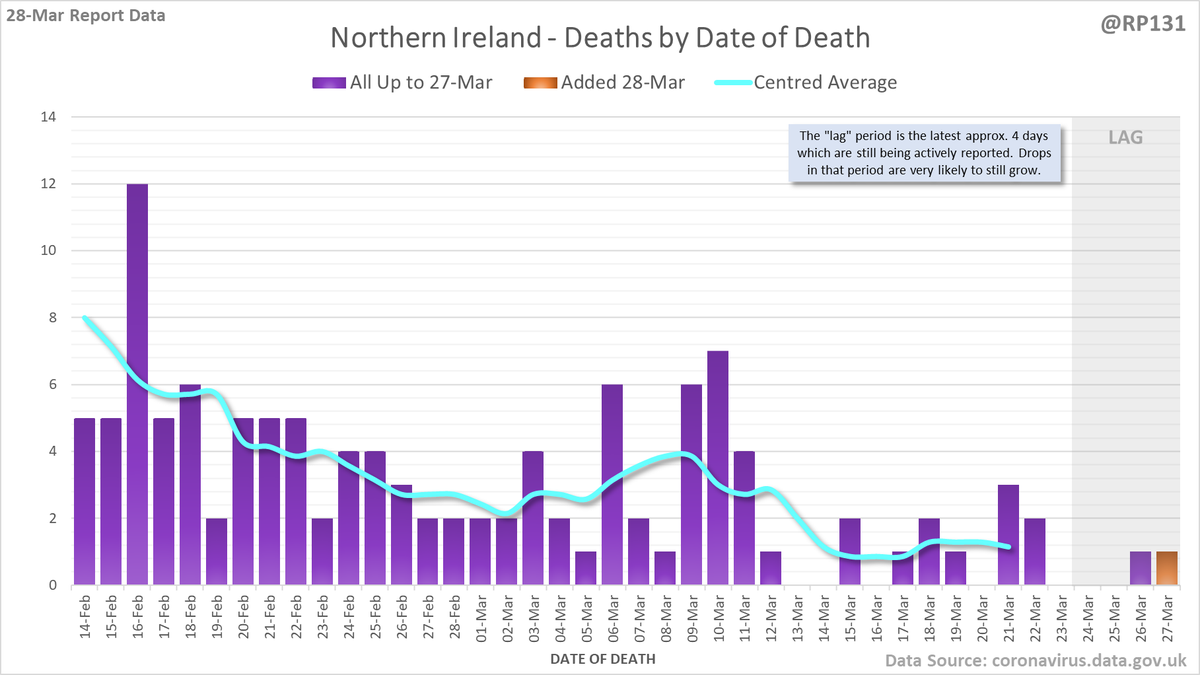
19 new #covid19uk deaths reported today (28-Mar). This brings the rolling average by date of death (allowing 4 days for lag) to 54 - which is a reduction of 41% in the last week and the lowest since 28-Sep (i.e. 174 days ago).
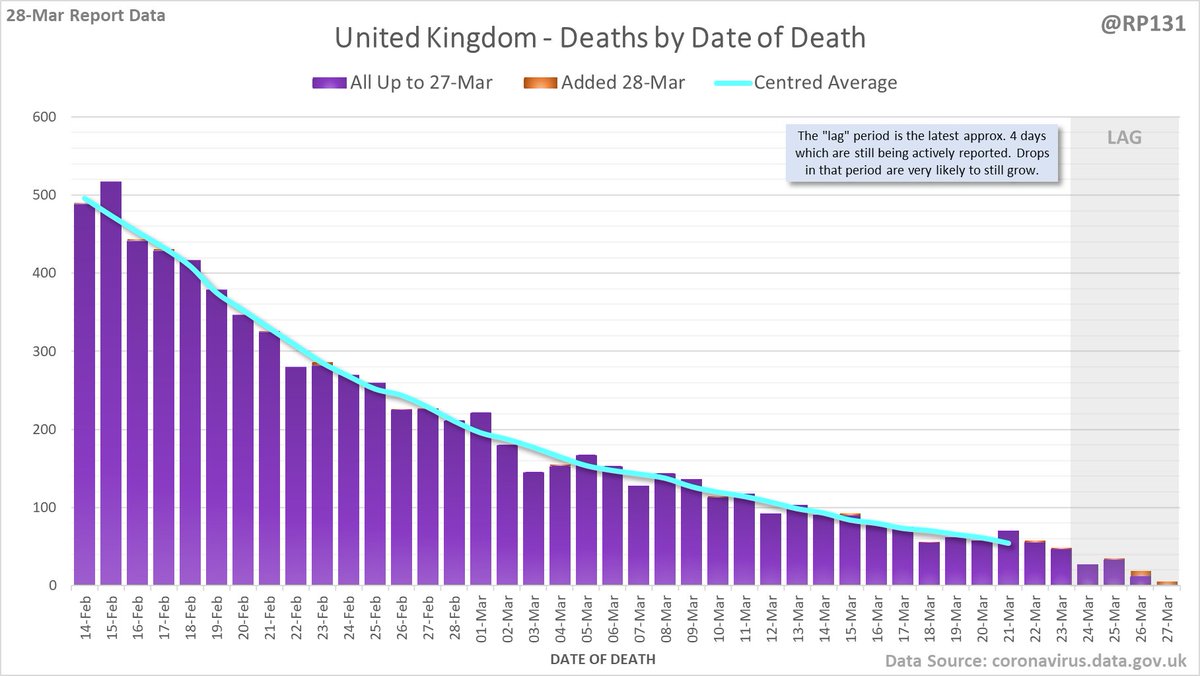
Closer look at the latest 45 days, with today's added numbers highlighted in orange. Individual nations and animated England charts further down the thread.
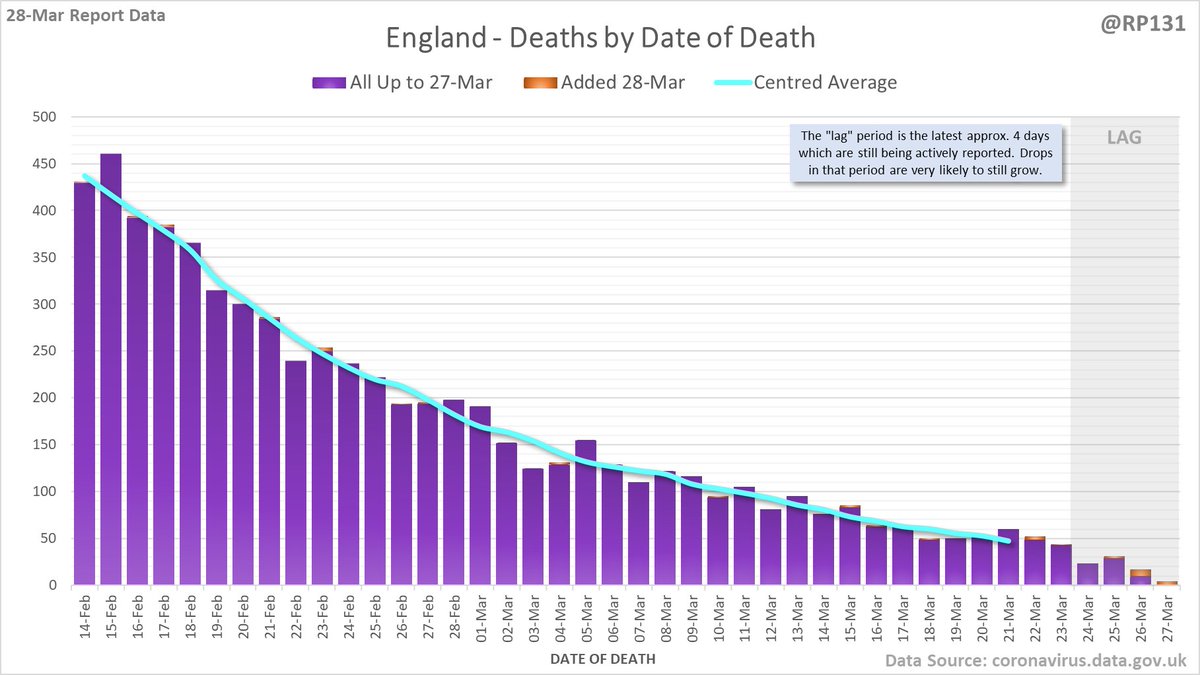
Separate charts for England (17) Scotland (0) Wales (0) and Northern Ireland (2). Note the different scales. Also on certain days the date-of-death data for Scotland/Wales/NI doesn't get updated so the orange bars may be mising or include multiple day's numbers.
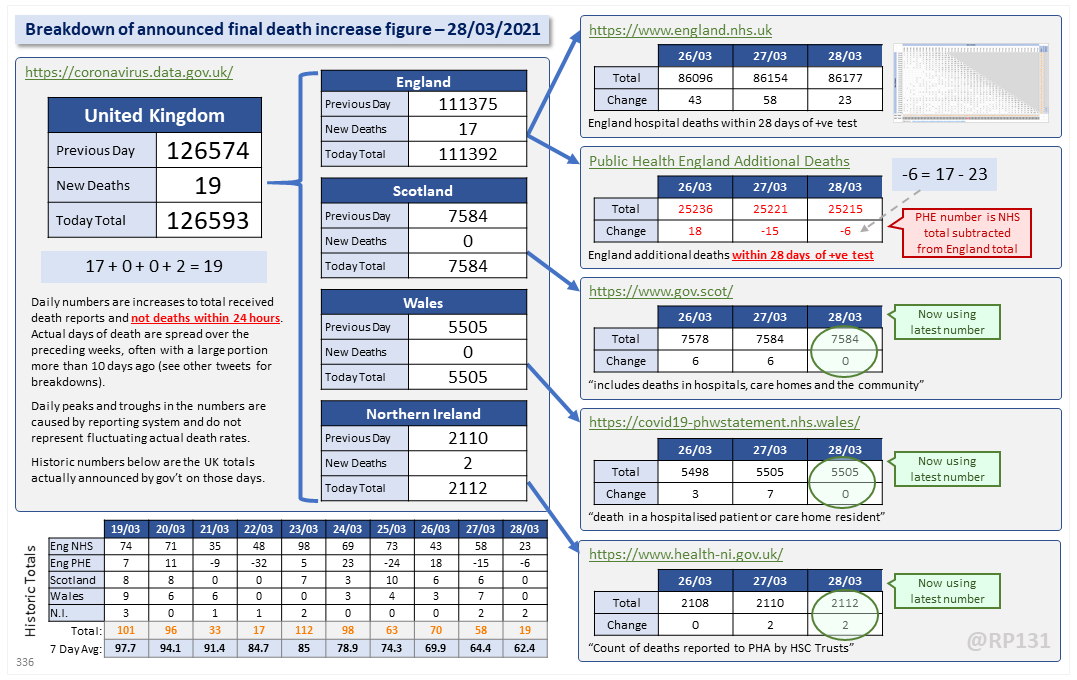
Dashboard for 28-Mar to explain where the #covid19uk total death increase figure of 19 actually comes from. The PHE dataset merge resulted in a net removal of 6 additional deaths today (hence the -6). This brings the 7 day rolling average DOWN by 2 to 62.4.
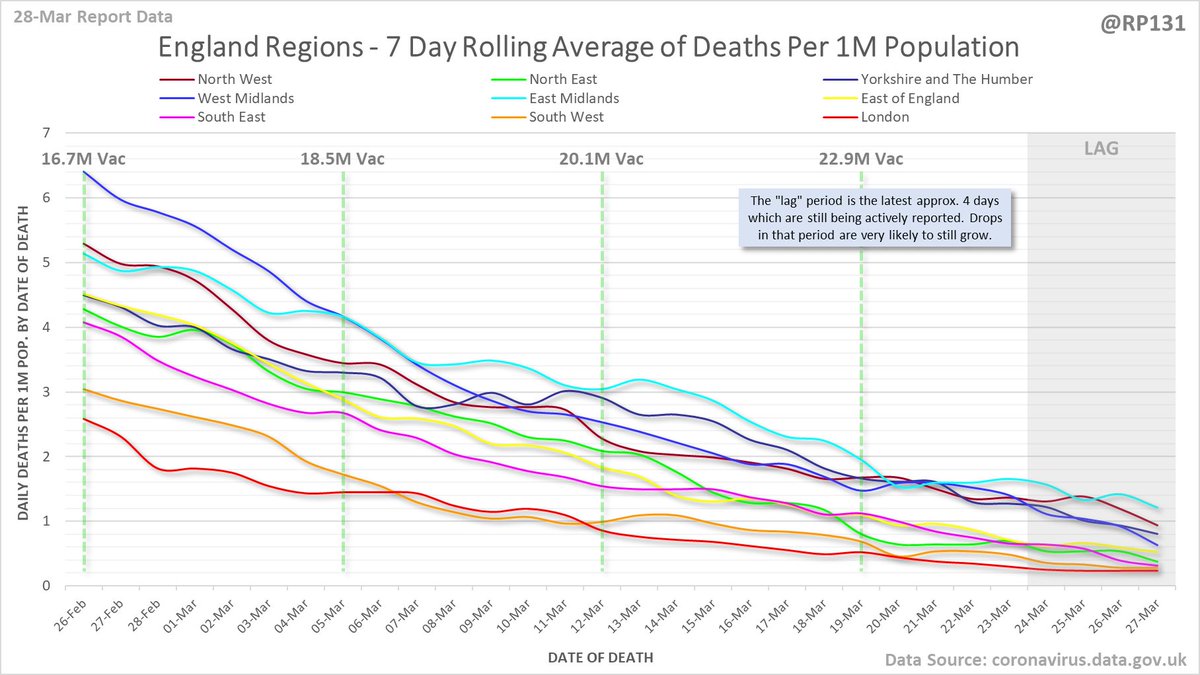
Date of death chart for England regions drawn with 7 day rolling averages of deaths per 1M population.
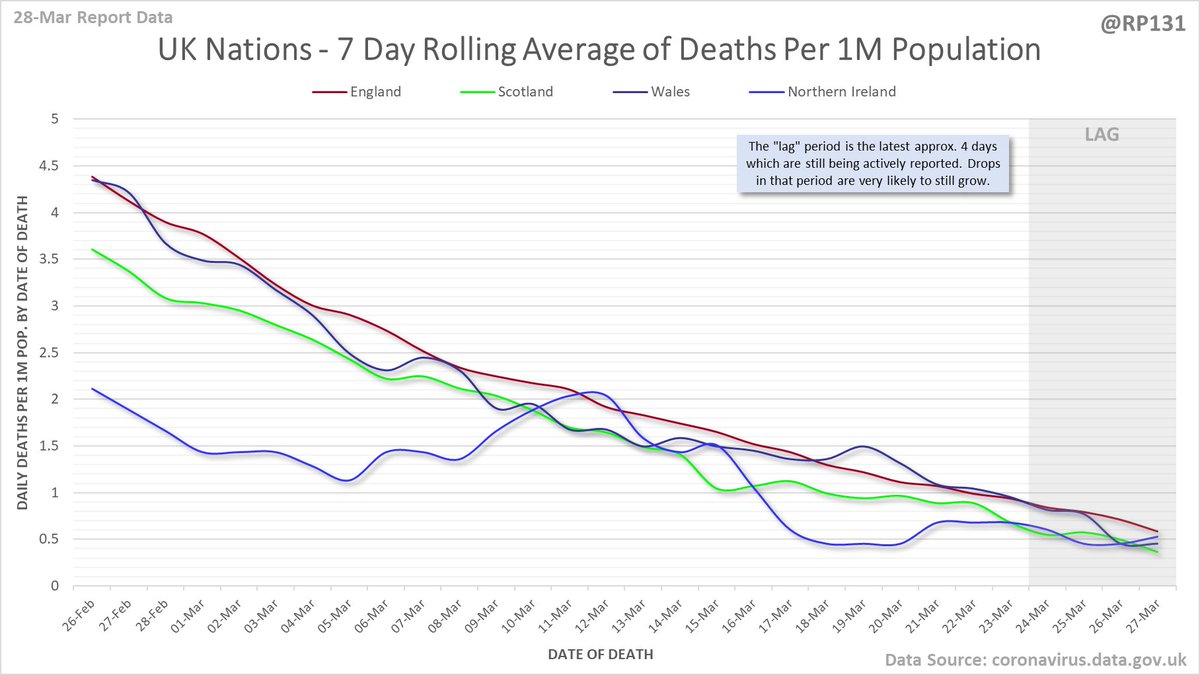
Date of death chart for UK nations drawn with 7 day rolling averages of deaths per 1M population.