THREAD "Limiting climate change to 1.5°C is now virtually impossible"
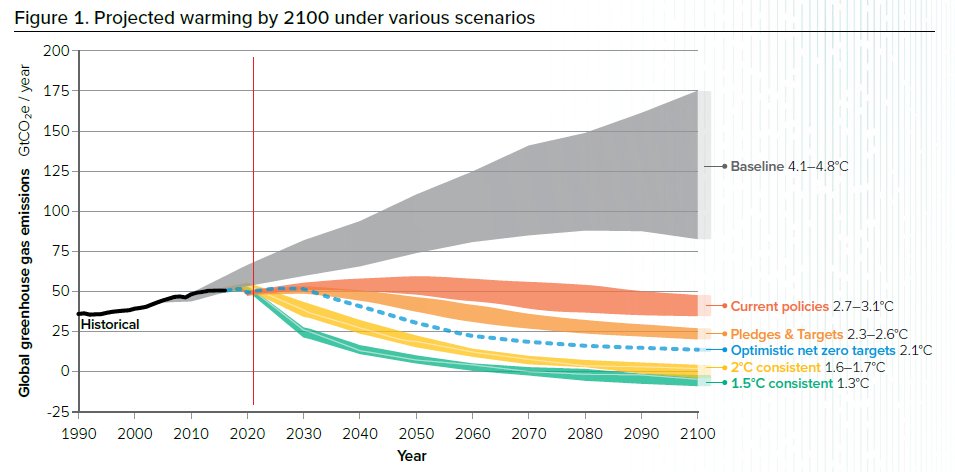
Therefore, a report that focuses on 3°C temperature rise by 2100 (2.7–3.1°C based on current climate policies).
While noting "acting early & urgently reduces the scale of the impacts"
science.org.au/supporting-sci…
Therefore, a report that focuses on 3°C temperature rise by 2100 (2.7–3.1°C based on current climate policies).
While noting "acting early & urgently reduces the scale of the impacts"
science.org.au/supporting-sci…
2. I am not sure what the fuss is about "virtually impossible"? Has anyone read the 'consensus' #IPCC #SR15?
The SPM writes 1.5°C pathways "require rapid & far-reaching transitions in energy, land, urban & infrastructure and industrial systems (𝒉𝒊𝒈𝒉 𝒄𝒐𝒏𝒇𝒊𝒅𝒆𝒏𝒄𝒆)"
The SPM writes 1.5°C pathways "require rapid & far-reaching transitions in energy, land, urban & infrastructure and industrial systems (𝒉𝒊𝒈𝒉 𝒄𝒐𝒏𝒇𝒊𝒅𝒆𝒏𝒄𝒆)"

3. Current "ambitions would not limit global warming to 1.5°C (𝒉𝒊𝒈𝒉 𝒄𝒐𝒏𝒇𝒊𝒅𝒆𝒏𝒄𝒆)"
Not even 'virtually', just "not" possible!
Noting, that even updated pledges so far lead to a 1% decrease in global emissions, not the required 45% reduction!
Not even 'virtually', just "not" possible!
Noting, that even updated pledges so far lead to a 1% decrease in global emissions, not the required 45% reduction!
https://twitter.com/Peters_Glen/status/1365578487810113538

4. Even if the world follows the oft-cited 50% by 2030, net-zero CO₂ by 2050, then CDR on massive scale in scenarios (100–1000 GtCO₂).
"CDR deployment of several hundreds of GtCO₂ is subject to multiple feasibility & sustainability constraints (𝒉𝒊𝒈𝒉 𝒄𝒐𝒏𝒇𝒊𝒅𝒆𝒏𝒄𝒆)"
"CDR deployment of several hundreds of GtCO₂ is subject to multiple feasibility & sustainability constraints (𝒉𝒊𝒈𝒉 𝒄𝒐𝒏𝒇𝒊𝒅𝒆𝒏𝒄𝒆)"

5. Yes, the 'carbon budget' is uncertain. Yet, everyone uses the smaller 66% budget for 1.5°C, not the 33% the-budget-is-uncertain bigger budget.
(Deduct 3*40=120GtCO₂ from these budgets to be relevant from today).
Of course, IPCC AR6 will update these budgets. Maybe bigger?
(Deduct 3*40=120GtCO₂ from these budgets to be relevant from today).
Of course, IPCC AR6 will update these budgets. Maybe bigger?

6. This paper really shows the uncertainty in a 1.5°C remaining carbon budget. It could be negative or it could be large.
An uncertain carbon budget could change 1.5°C from "virtually impossible" to anything from "impossible" to just "challenging".
nature.com/articles/s4324…
An uncertain carbon budget could change 1.5°C from "virtually impossible" to anything from "impossible" to just "challenging".
nature.com/articles/s4324…

7. I am going to get @'ed this thread from @JoeriRogelj a billion times today.
I understand Joeri thinks "virtually impossible" is overplaying, but saying 1.5°C is "challenging" is underplaying (IMHO).
Note: "virtually impossible" ≠ "impossible"
I understand Joeri thinks "virtually impossible" is overplaying, but saying 1.5°C is "challenging" is underplaying (IMHO).
Note: "virtually impossible" ≠ "impossible"
https://twitter.com/JoeriRogelj/status/1377409112086966274
8. With "virtually impossible", it is important to note there is still a huge role for deep mitigation.
The IPCC did a good job at trying to reframe from a 1.5°C 'deadline'.
“Every bit of warming matters, every year matters, every choice matters”
The IPCC did a good job at trying to reframe from a 1.5°C 'deadline'.
“Every bit of warming matters, every year matters, every choice matters”
https://twitter.com/Peters_Glen/status/1360146095033180161
9. It seems 1.5°C has come down to semantics, "virtually impossible" versus "challenging"?
I see my job as a scientist to be frank on the challenges, but to doomsdayers, noting the challenges is not the same as giving up. Still plenty to fight for.
cicero.oslo.no/no/posts/klima…
/end
I see my job as a scientist to be frank on the challenges, but to doomsdayers, noting the challenges is not the same as giving up. Still plenty to fight for.
cicero.oslo.no/no/posts/klima…
/end

Bonus tweet 1: I think the scientific community has done itself a disservice with framing carbon budgets as single numbers with a probability (eg 475 GtCO₂ for a 66% chance).
Better to use ranges (eg 760 GtCO₂ with 33–66% range 475–930 GtCO₂). rdcu.be/bHT2C
Better to use ranges (eg 760 GtCO₂ with 33–66% range 475–930 GtCO₂). rdcu.be/bHT2C
Bonus tweet 2: Using a single number gives a false precision, & leads to the "12 years to..." framing.
A range explicitly brings in the uncertainty, & allows more nuance to be given on the feasibility of 1.5°C. This would avoid much of this thread...
A range explicitly brings in the uncertainty, & allows more nuance to be given on the feasibility of 1.5°C. This would avoid much of this thread...
Bonus tweet 3: Here is the 5-95% temperature uncertainty for 1.5°C scenarios from two simple climate models (FAIR, MAGICC) used in SR15. The peak temperature ranges from 1.1°C to >2°C.
If FAIR is correct, 1.5°C is not 'virtually impossible'...
If FAIR is correct, 1.5°C is not 'virtually impossible'...

• • •
Missing some Tweet in this thread? You can try to
force a refresh