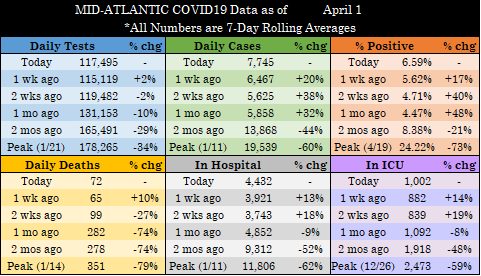
All graphics are 7-day averages. Today’s raw reporting for each metric is in the tweet below.
(Data retrieved directly from state dashboards. Not every state updates its numbers daily.)
UNITED STATES
Today’s raw reported metrics:
- Tests: 1,824,684 (+174,702)
- Cases: 73,006 (+10,373)
- Deaths: 1,020 (-239)
- Currently Hospitalized: 37,203 (-190)
- Currently in ICU: 7,079 (-86)
(+/- compared to same day last week for Tests/Cases/Deaths & yesterday for Hosp/ICU)
Average reported daily deaths fell below 900 today for the first time since 11/5. And they’re likely even lower. MI added 33 matching deaths today. WV had about the same yesterday. And look CA’s dates for the 154 reported today:
With actual daily deaths lower, and logistical time potentially freeing up, several states will likely continue to audit, match, update, etc. their death numbers. We’ll pull them out of trend data if they are massive dumps, but it’s just too much work to keep up with each one.
This means 2 things: (1) we should see a sharper decline once most states are reporting only recent(ish) deaths, and (2) the late fall/winter death toll was worse than the reporting at the time indicated. But brighter days should be in our very near future.
Here’s today’s vaccine update. We’re sneaking up on that 3M number, and it seems like we’ll see it any day now.
A few days ago, I stumbled upon an exchange between @michaelsfuhrer, @greg_travis, @karencutter4, @PienaarJm.
The crux is Greg’s claim of a sharp increase from 2022 to 2023 in 18-44yo deaths from disease in the US (his graphic below).
Greg is wrong.
Join me on a 12-pack 🧵
2/ It quickly became apparent that the main point of contention was whether including R99-coded deaths (“Other ill-defined and unspecified causes of mortality”) in Greg's definition of deaths from disease, as they are later re-coded to non-disease deaths.
3/ Oh, but not to worry. Greg states that "R99 itself is a tiny portion of overall deaths and generally resolves to <2,000 deaths a month overall (out of 300K deaths a month)."
Weekly #Covid19 update in my Substack newsletter, The Issue. Just click the link below.
I'll excerpt a few portions below, but the upshot is: steady rise in cases/% positive, lower rise in Hosps, even lower for ICUs, and continued decline in deaths. thelawyercraig.substack.com/p/covid-19-wee…
"Despite the rise in other metrics, deaths late last week dropped below 300 (7-day-average) for the first time since June/July 2021. ICU census is still well below pre-Omicron pandemic lows."
"Perhaps the best news right now is global Covid deaths. According to Our World in Data, global daily confirmed Covid-19 deaths (7DA) have dropped to 1,772. For comparison, . . . our lowest ever number globally was 4,436 before Omicron entered the picture."
I cannot overstate the absolute idiocy of touting this study purporting to show Omicron is just as likely to send someone to the hospital or the morgue as Delta.
There are 2 enormous issues with this study (among others, I'm sure).
2/ ISSUE #1: The authors use PCR positives as the case denominator and just assume that the "case-to-infection" ratio was similar between all 4 periods. Unbelievable.
The fact that a study can look at the data and just say this boggles my mind. Just read that green highlighting!
3/ Here were Massachusetts' peak positive testing percentages for the 4 different periods in the study (data = @CDCgov)
8.69% - Winter 20-21
2.62% - Spring 21 (sub-1% for 38 days!)
4.47% - "Delta" (per the study)
23.36% - "Omicron"
#Covid19 in South Africa...5th wave? Well, that depends on what metric you use to define wave.
Thread 🧵🧵🧵
2/ If you look at 7DA cases, it's a clear increase. It's a long way off from the OG Omicron peak (and not quite as vertical), but they're still up ~4x in barely over 2 weeks.
3/ But everywhere is testing a bit less these days, so what about % positive? Yep, even more vertical, and more closely resembles the prior waves.
Of course, these are all just tests/infections. Let's look at outcomes...
Down 91.5% from peak. Seeing a rise nationally from recent low of 2.13%. During the entire pandemic, was only lower in June 2021 than our recent numbers.