Today in the #AtlanticBubble
18 new cases were reported in the region today: 7 in Nova Scotia and 11 in New Brunswick.
11/19 were traced at the time of reporting (ooof)
There are now 213 known, active cases in in Atlantic Canada.
18 new cases were reported in the region today: 7 in Nova Scotia and 11 in New Brunswick.
11/19 were traced at the time of reporting (ooof)
There are now 213 known, active cases in in Atlantic Canada.


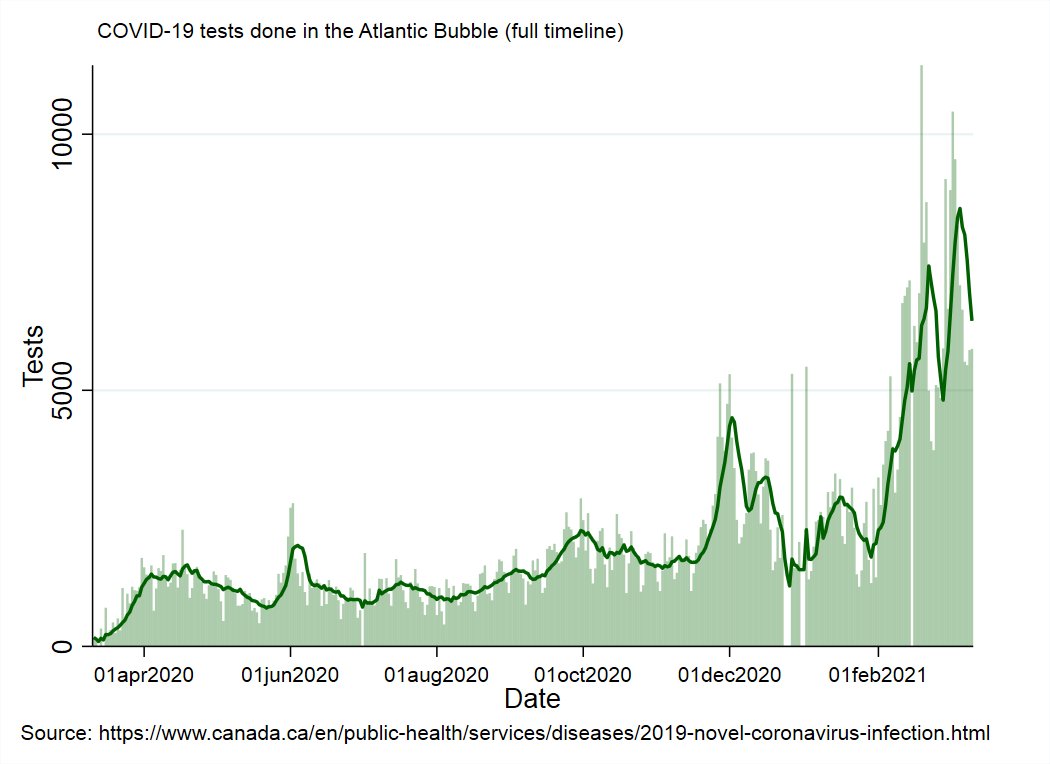
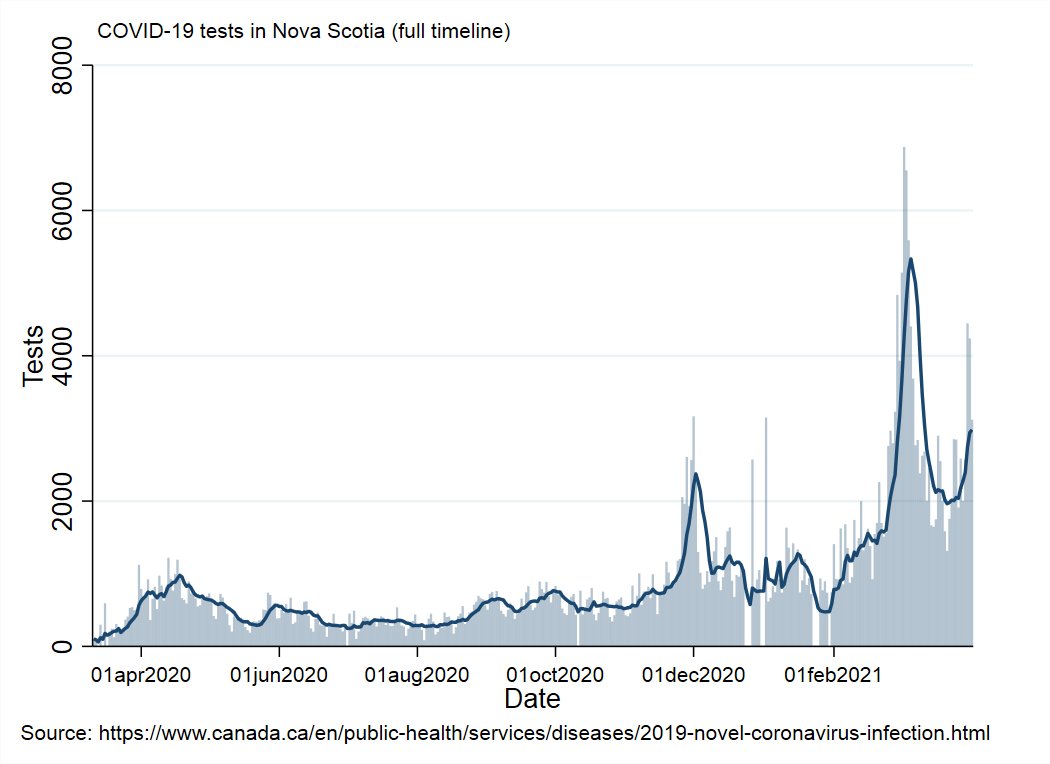
It's the weekend, so I'm reporting on testing.
The region's test positivity rate was 0.27% this week.
The region's test positivity rate was 0.27% this week.

PEI didn't update their numbers today, so there are still 13 known, active cases in PEI.


PEI's test positivity rate this week was 0.19%. Testing is down a bit after their recent cluster seems to have cleared (fingers crossed).


NL isn't reporting this weekend because of the holiday, so as far as anyone knows there are still 4 known, active cases in NL.


NL's test positivity rate for the week was 0.14%.


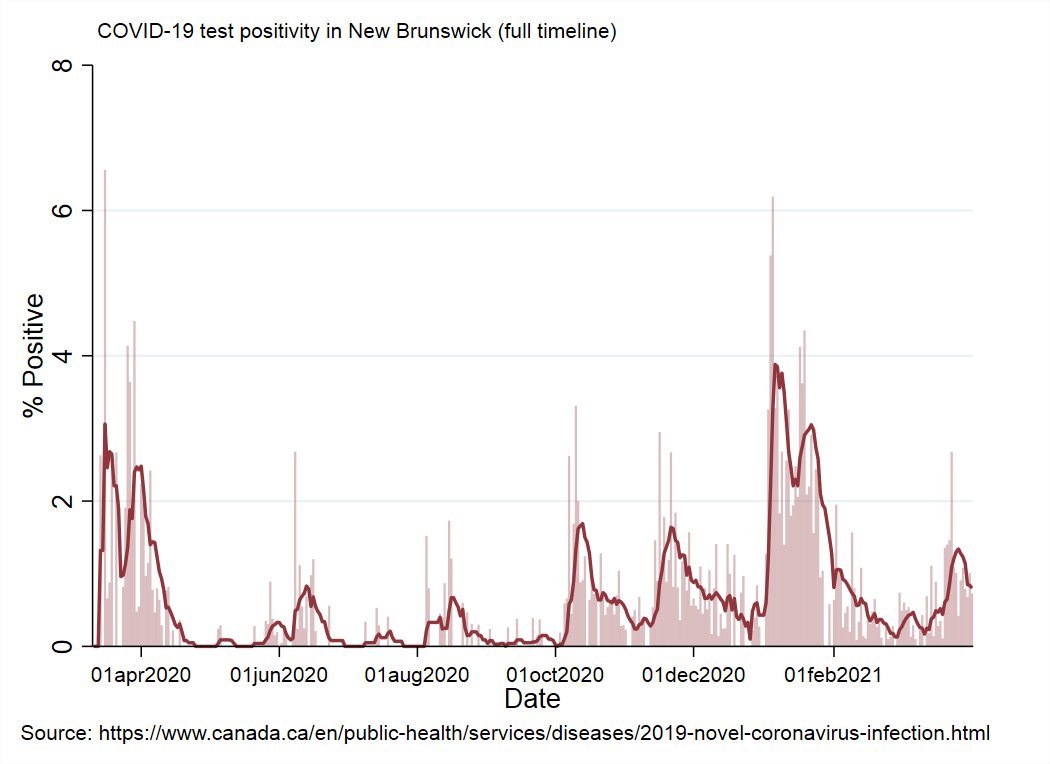
NB reported 11 new cases today: 2 in the Saint John area (1 close contact of an existing case and 1 related to travel), and 9 in the Edmundston area (2 close contacts of existing cases and 7 under investigation).
There are now 162 known, active cases in NB.
There are now 162 known, active cases in NB.


Updated case levels and restrictions map for NB and case timeline at the health region level for NB with Edmundston emphasized.


NB's test positivity rate this week was 0.8%

NS reported 7 new cases today: 1 travel related case in the Eastern zone, 3 close contacts of existing cases in the Western zone, and 3 in the Halifax area (1 travel-related and 2 close contacts).
There are now 34 known, active cases in NS.
There are now 34 known, active cases in NS.

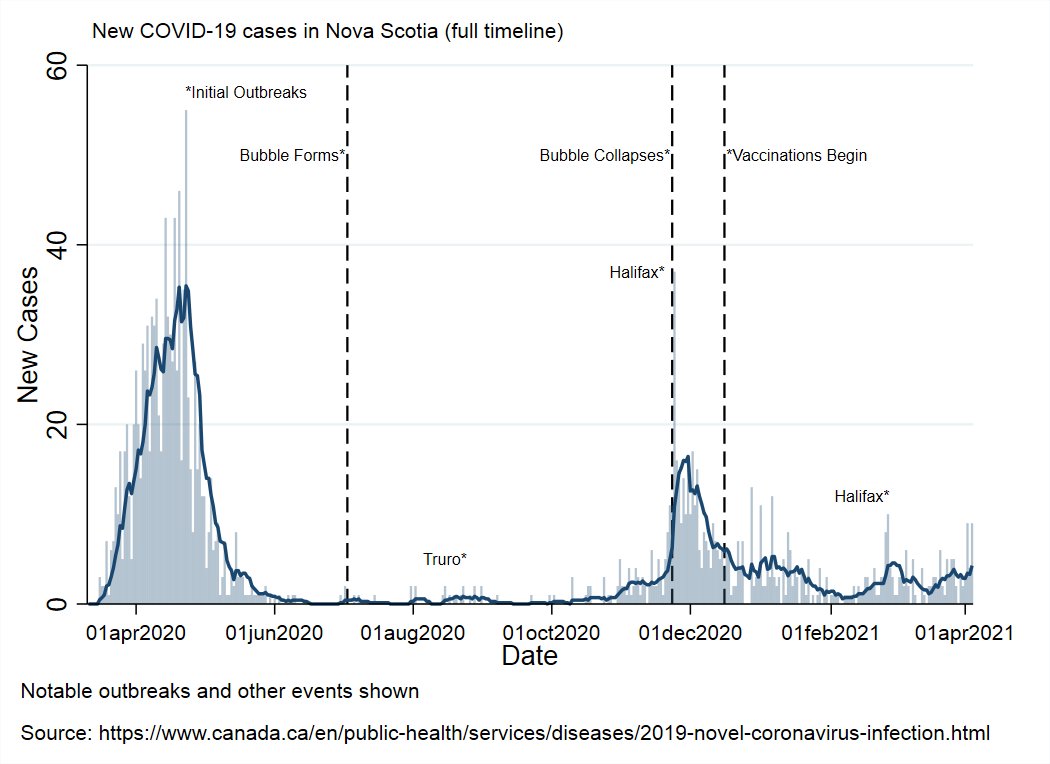


NS test positivity rate for the week was 0.11%.

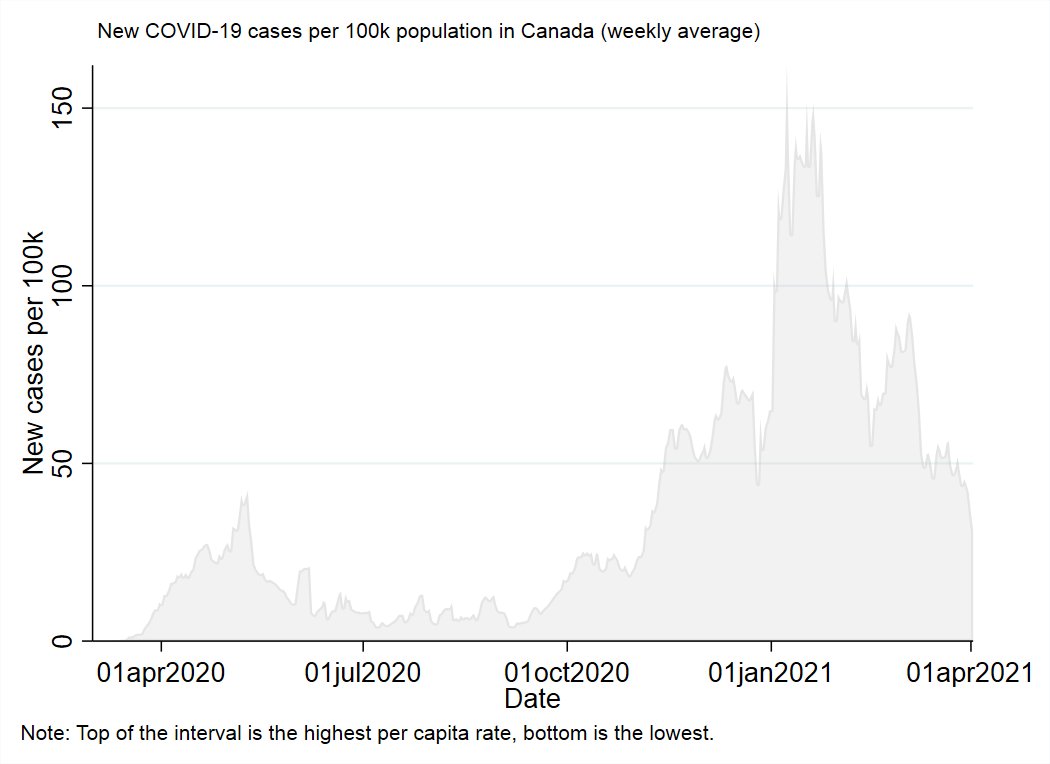
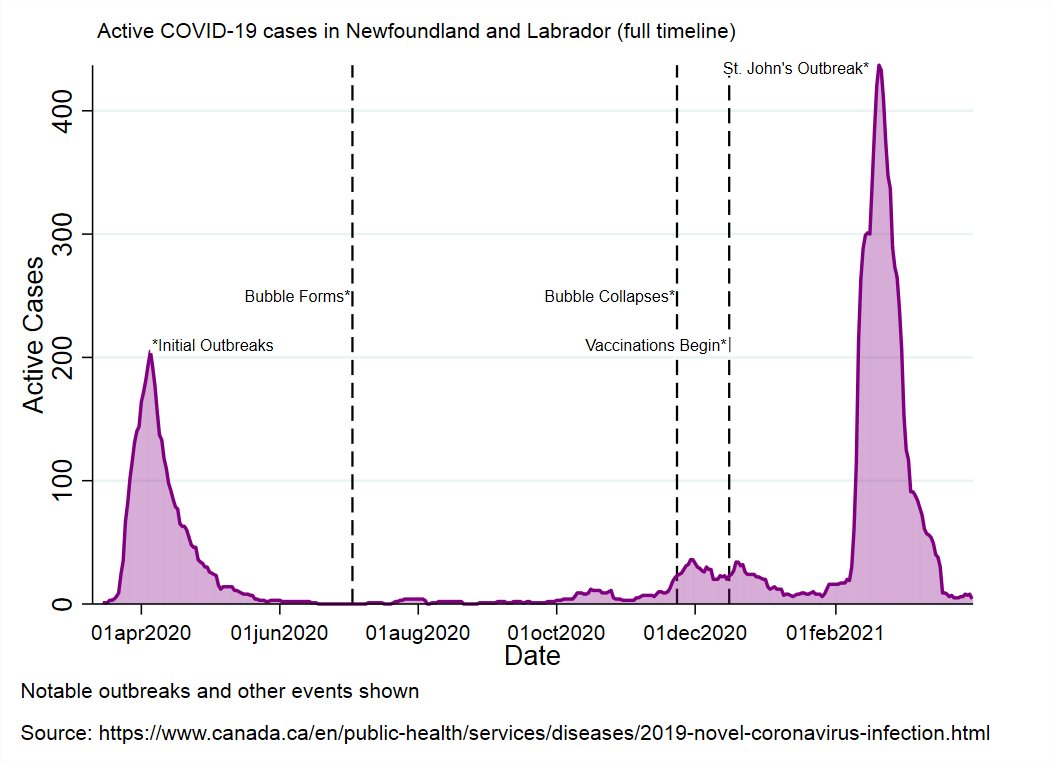
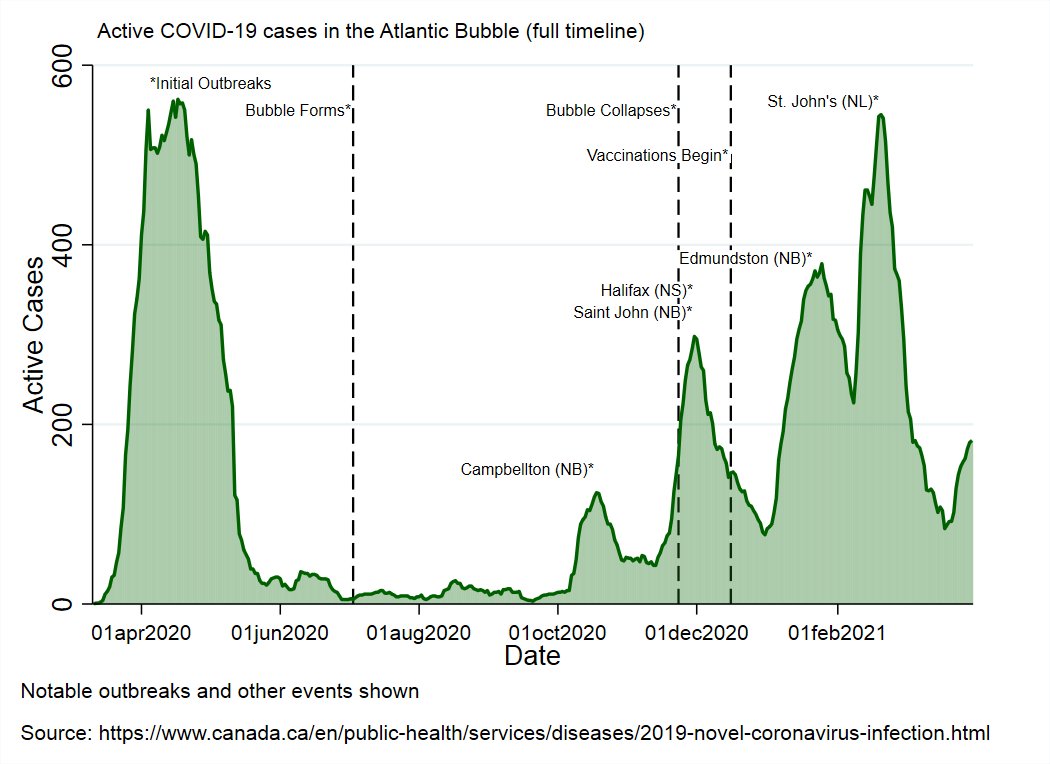
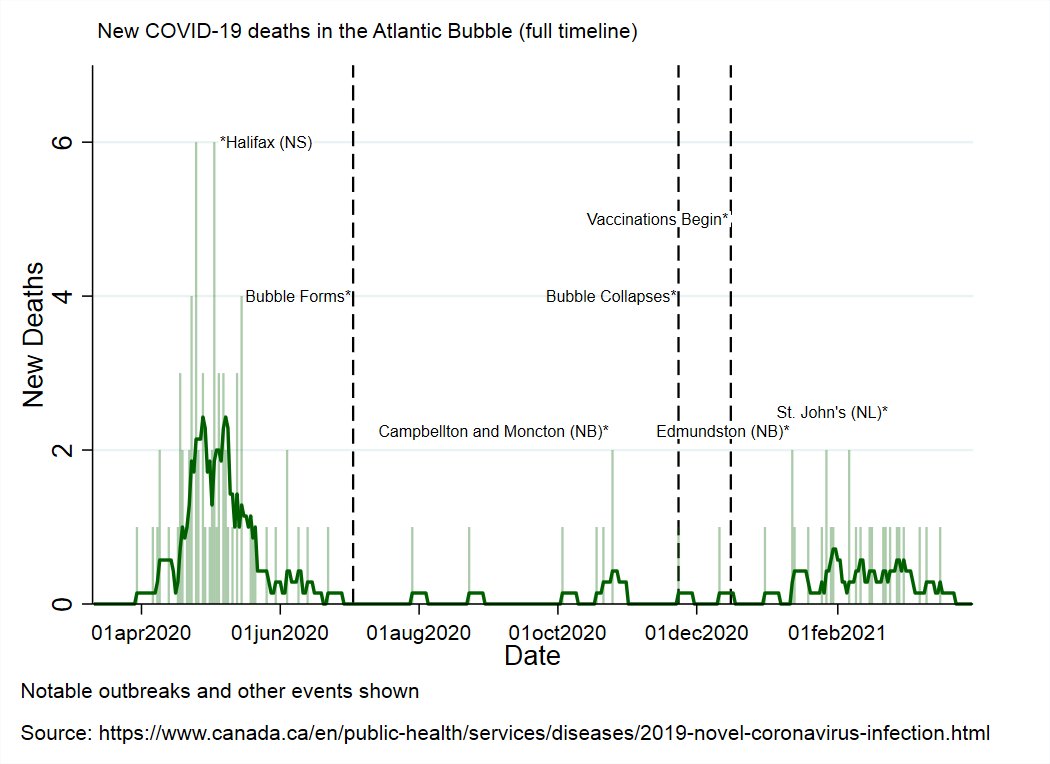
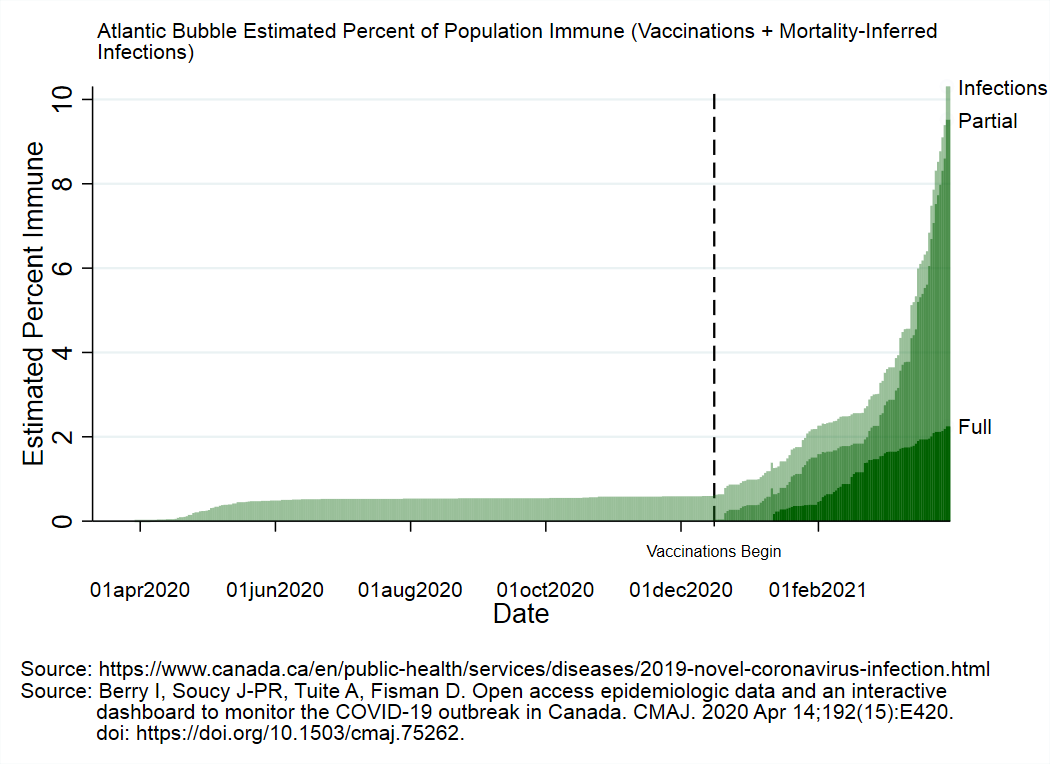
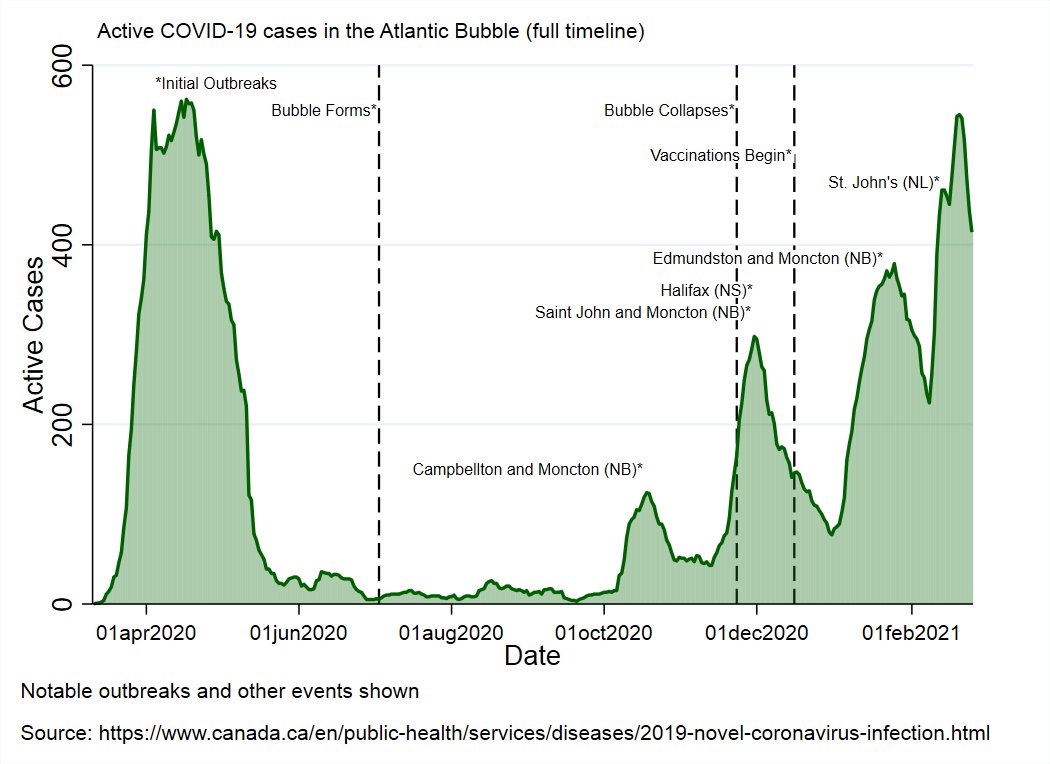
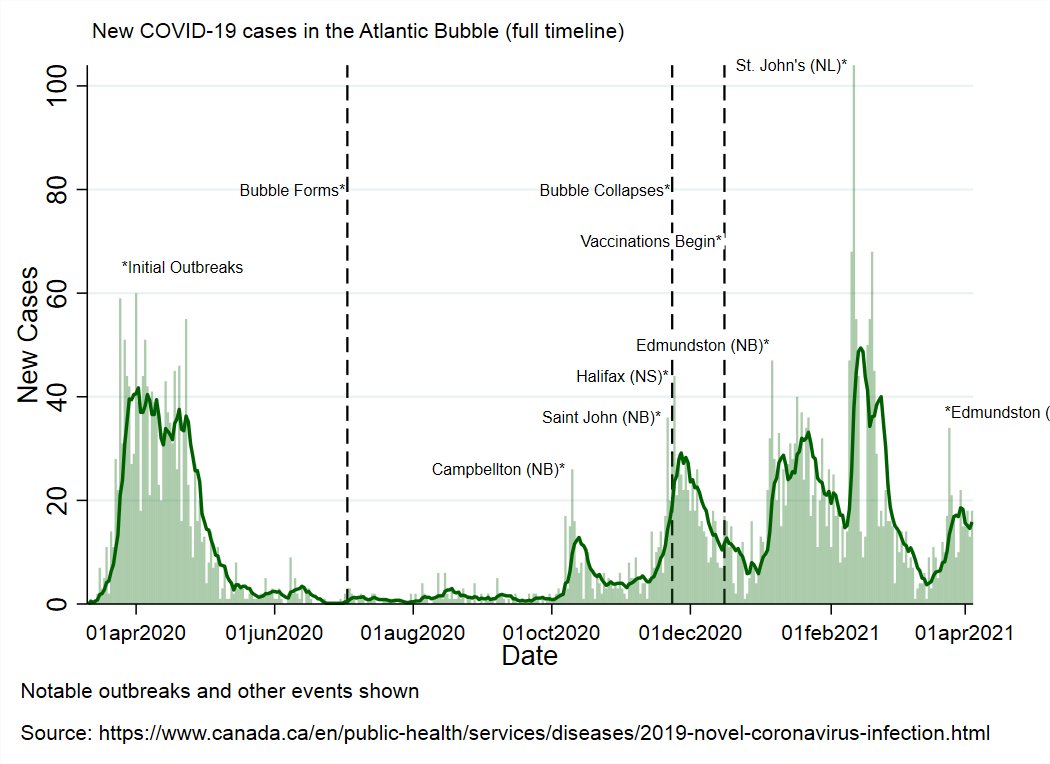
Here's the updated pandemic timeline for the Atlantic region and surrounding areas.
Western NS is visible on the map - it seems a group of migrant workers in isolation have tested +.
Things getting steadily worse in both Maine and the parts of Quebec adjacent to New Brunswick.
Western NS is visible on the map - it seems a group of migrant workers in isolation have tested +.
Things getting steadily worse in both Maine and the parts of Quebec adjacent to New Brunswick.
Provincial and Territorial Vaccine Roll-Out
Top of the ribbon is doses distributed, bottom is doses administered.
The higher the ribbon goes, the more people are being vaccinated. The wider it gets, the more doses sit unused.
National ribbon outlined in black.
Top of the ribbon is doses distributed, bottom is doses administered.
The higher the ribbon goes, the more people are being vaccinated. The wider it gets, the more doses sit unused.
National ribbon outlined in black.
Vaccine Roll-Out Metrics
1st graph is percent of distributed doses that have been used.
2nd graph shows how many days since each province had enough doses to cover their current usage.
3rd graph shows percent of eligible population that is newly vaccinated each day.
1st graph is percent of distributed doses that have been used.
2nd graph shows how many days since each province had enough doses to cover their current usage.
3rd graph shows percent of eligible population that is newly vaccinated each day.


This animation shows each province's vaccination pace as a percent of the pace they need to each 80% first dose coverage by the end of June (based on how many they have already vaccinated and how much time is left.
Older data becomes less visible over time.
Older data becomes less visible over time.
Here is each province's coverage of the eligible population by at least one dose (2nd graph shows the Territories).
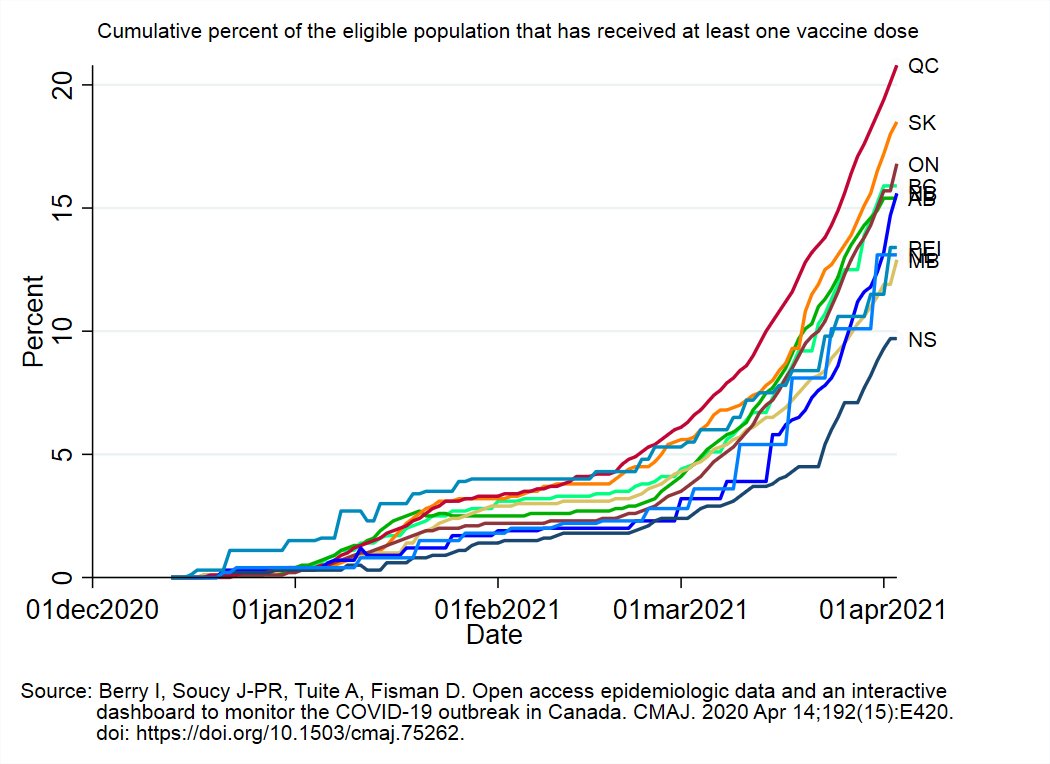

% eligible with at least one dose / % eligible that can get a first dose with what's in storage right now:
BC: 15.9% / 4.6%
AB: 15.4% / 5.5%
SK: 18.5% / 1.9%
MB: 12.9% / 12.5%
ON: 16.8% / 3.2%
QC: 20.8% / 7.0%
NB: 15.6% / 4.6%
NS: 9.7% / 9.4%
NL: 13.1% / 3.6%
PEI: 13.4% / 5.0%
BC: 15.9% / 4.6%
AB: 15.4% / 5.5%
SK: 18.5% / 1.9%
MB: 12.9% / 12.5%
ON: 16.8% / 3.2%
QC: 20.8% / 7.0%
NB: 15.6% / 4.6%
NS: 9.7% / 9.4%
NL: 13.1% / 3.6%
PEI: 13.4% / 5.0%
NB is now the fastest vaccinating province, QC has passed 20% with most of the country in hot pursuit, and NS should pass 10% early this week. Nice!
That's it for tonight's update.
It's a holiday so you may be out and about more than usual and visiting family from out of town. Make sure to swing by and get tested if that's available where you are.
Have a great rest of the holiday weekend!
It's a holiday so you may be out and about more than usual and visiting family from out of town. Make sure to swing by and get tested if that's available where you are.
Have a great rest of the holiday weekend!
• • •
Missing some Tweet in this thread? You can try to
force a refresh