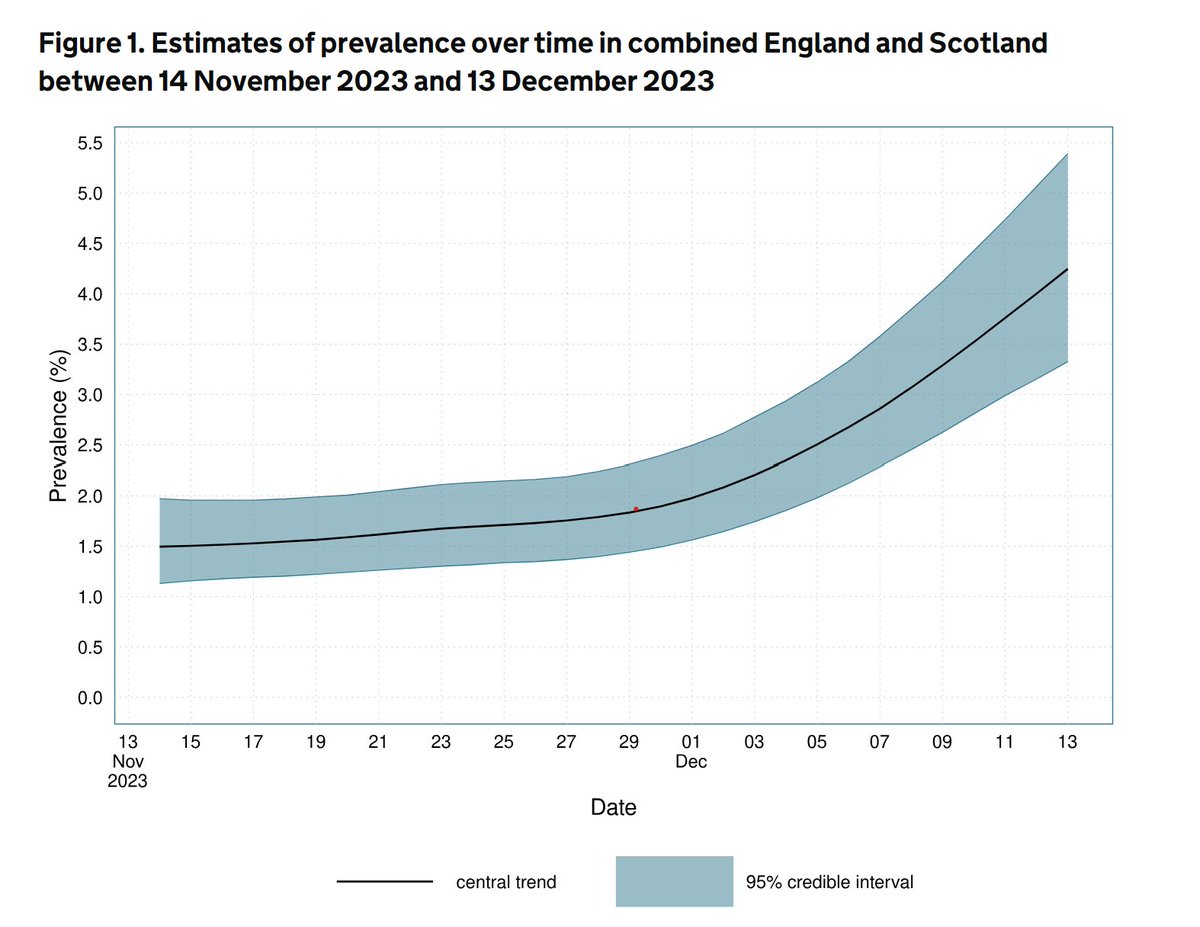
The latest @imperialcollege #REACT study shows a sharp fall since the last report, with infection levels falling by 60% from 0.49% to 0.20% (0.17%, 0.23%).
It suggests that within the round the decline has levelled, and puts R at 1.0 for the period.
spiral.imperial.ac.uk/bitstream/1004…
1/9
It suggests that within the round the decline has levelled, and puts R at 1.0 for the period.
spiral.imperial.ac.uk/bitstream/1004…
1/9

Round 10 (11/3 to 30/3) saw 227 positive tests out of 141k swabs, and the central estimate is now at its lowest since early September. It's slightly below the latest ONS figure for England too, of 0.27% (for the week to 27th March).
2/9
2/9

The movement between Rd 9 and 10 suggests an R of 0.84 , but samples collected within the round indicate that the fall has levelled off.
Notice though that there is a wide CI (0.81% to 1.21%), reflecting uncertainty as to whether there is still some fall or even a rise.
3/9
Notice though that there is a wide CI (0.81% to 1.21%), reflecting uncertainty as to whether there is still some fall or even a rise.
3/9

Regionally, the surprise here is quite how low the SE is. We see the same gradient from north to south that the ONS is picking up too. The north is around double the levels seen in London.
4/9
4/9

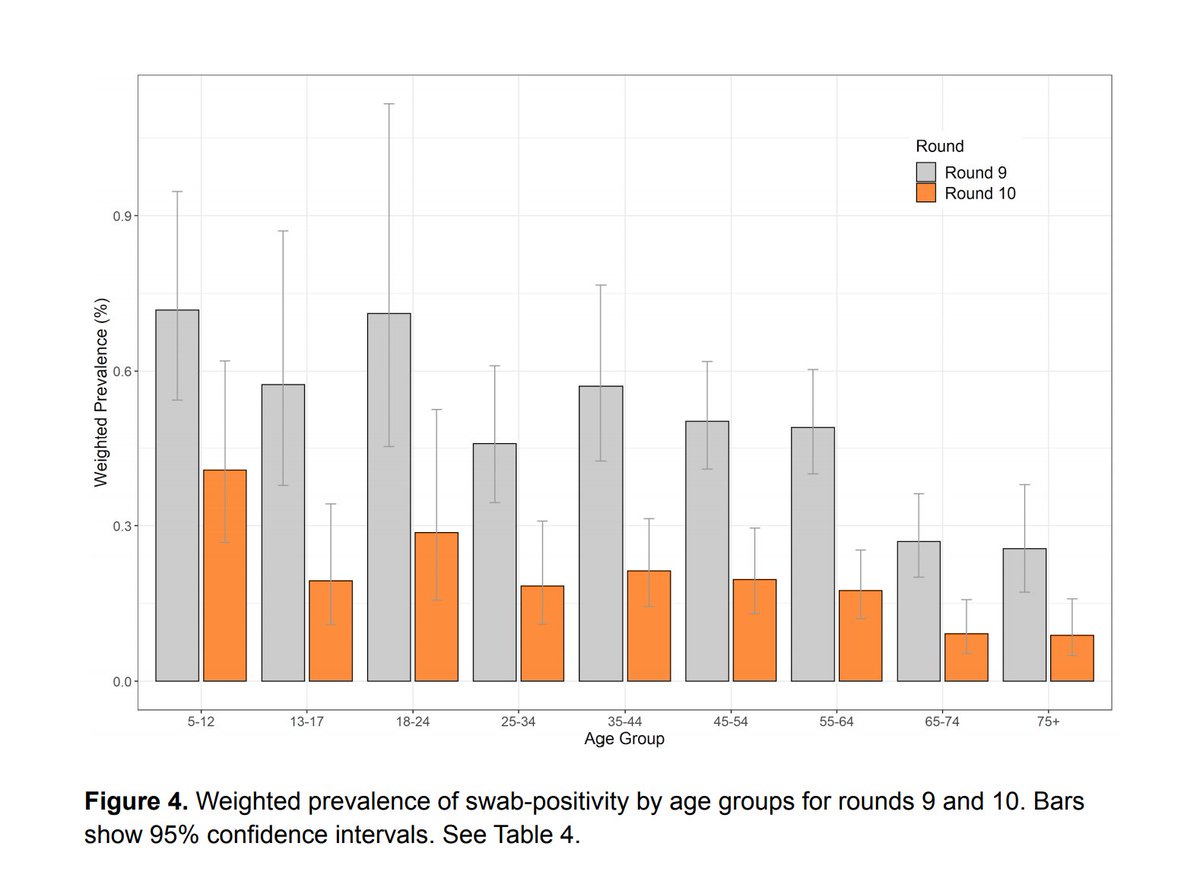
All age groups have fallen, maybe surprising given the return of schools, although the proportionate fall is less in the 5-12 age band. The oldest age groups are still seeing some infections, although now less than 0.1% (around 1 in 1,100).
5/9
5/9
The study fits its historic data to hospital admission and finds a very good fit until recently. Admissions are now dropping below the infection curve since February, likely to be a vaccine effect.
6/9
6/9

The same vaccine effect is seen in deaths too, but very much more apparent, and starting earlier in mid-Jan. That timing and subsequent acceleration is in line with predictions made by @Doctimcook and myself as reported here.
7/9
7/9
https://twitter.com/Anaes_Journal/status/1379720603498872832

The usual detailed table is provided. CI's are typically wider now with fewer positive cases. One unusual result (compared to previous studies) is the ethnic comparison, with black lower than white. But with only 4 cases and a very wide CI, it should be treated with caution.
8/9
8/9

This study is one of several surveillance measures, including ZOE, PHE and ONS. All have their strengths and weaknesses, and so it's important to consider them in totality rather than isolation.
A big thanks to all at @imperialcollege and @IpsosMORI involved in the study.
9/9
A big thanks to all at @imperialcollege and @IpsosMORI involved in the study.
9/9
• • •
Missing some Tweet in this thread? You can try to
force a refresh