Trevor Tombe Profile picture
Apr 9, 2021 10 tweets 5 min read Read on X
Today's COVID vaccination update:

- Total shots given: 7,569,321
- Shots per 100 people: 19.9
- Shots reported today: 316,761 (new record!)
- Inventory: 13.8 days (at avg pace)

Source: covid19tracker.ca/vaccinationtra…
Canada is now up to 7.6 million shots given -- which is 71.8% of the total 10.5M doses available. Over the past 7 days, 2,718,570 doses have been delivered to provinces.

And so far 780k are fully vaccinated with two shots.
Canada's pace of vaccination:

Today's 316,761 doses today compares to an average of 216,033/day over the past week and 179,451/day the week prior.

- Pace req'd for 2 doses to 75% of Canadians by Sept 30, 2021: 284,153
- At current avg pace, we reach 75% by Nov 2021
But based on just the share of people with 1 or more doses (a weaker threshold), at Canada's current pace we reach 25% by April, 50% by June, and 75% by July 2021.
For context, at Canada's current pace of vaccination the share of people with 1 or more doses increases by 0.54% per day. The U.S. increases this share by 0.54% per day. For Canada to reach the current U.S. share would take 31 days.
Turning to individual provinces, here's doses administered over time and the latest share of deliveries used. YT leading with 77.2% of delivered doses administered while NS has administered 52.2%.
To visualize the pace of vaccination across provs, here's time to reach 75% of adults w/ 1+ doses based on the latest 7-day average daily pace.

- NL fastest at 52 days.
- NS slowest at 137 days.
How does Canada compare to others? Currently, Canada ranks 7th out of 37 OECD countries in terms of the share of the population that is at least partially vaccinated. In terms of total doses per 100, Canada is 17th.

Source: ourworldindata.org/covid-vaccinat…
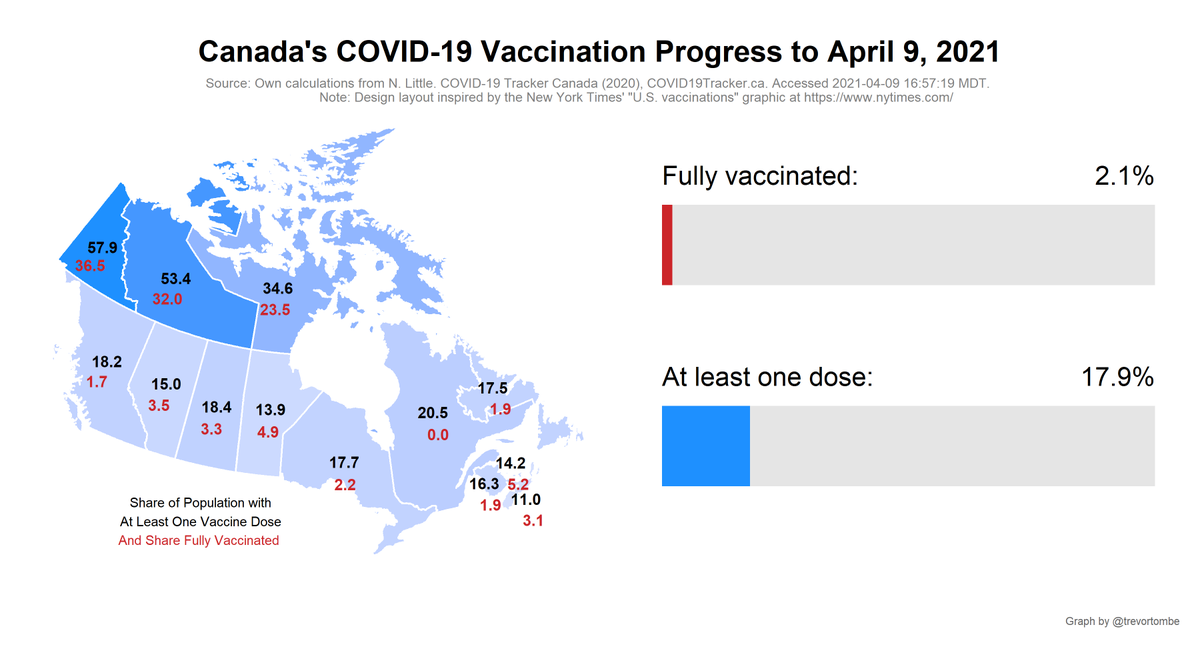
Canada/US comparison:

- Highest Prov: QC, 20.5% of pop w/ at least one dose
- Lowest Prov: NS, 11.0
- Highest State: NH, 43.2
- Lowest State: AL, 25.1

- Top CDN Terr: YT, 57.9
- Top US Terr: PW, 45.4

Sources: covid.cdc.gov/covid-data-tra… and covid19tracker.ca/vaccinationtra…
Not only is Canada's average daily pace of increasing vaccine coverage now equal to the U.S., our average pace of delivering doses is 4th in the OECD. Great improvement recently, fantastic to see! 💉💉

• • •

Missing some Tweet in this thread? You can try to force a refresh
 

Keep Current with Trevor Tombe

Trevor Tombe Profile picture

Stay in touch and get notified when new unrolls are available from this author!

Read all threads

This Thread may be Removed Anytime!

PDF

Twitter may remove this content at anytime! Save it as PDF for later use!

Try unrolling a thread yourself!

how to unroll video
  1. Follow @ThreadReaderApp to mention us!

  2. From a Twitter thread mention us with a keyword "unroll"
@threadreaderapp unroll

Practice here first or read more on our help page!

More from @trevortombe

May 21
Today's data: inflation rate falls to 2.7% in April. Would have fallen more, but gasoline pushed the rate up. Shelter remains largest contributor, but pace of increase is falling.

#cdnecon #cdnpoli www150.statcan.gc.ca/n1/daily-quoti…
Image
The key Bank of Canada core measures of inflation have also remained within the target range -- lower than 2% -- over the past 3 months. This is what the bank is looking forward before lowering rates. Image
Here are the contributors to the drop. Most items down, but energy prices offset some of that.

This accounts for *changes* in the CPI annual rate of increase. Alternatively, had energy prices remained flat yoy, then CPI growth would have been 2.4% in April. Image
Read 4 tweets
Feb 20
Today's data: inflation! 🥳 Prices were 2.9%, on average, higher in January than a year earlier. Inflation down from 3.4% in Dec. Biggest contributors to the drop were energy, food, travel. Cell phones offsetting some.


#cdnecon #cdnpoli www150.statcan.gc.ca/n1/daily-quoti…
Image
Looking at the headline rate, shelter is larger contributor. Rent accounts for ~0.5 points of the 2.9, mortgage interest costs ~1.0 points.

Important: note the strong decline in the pace of grocery price growth. Now in line with historical norm. Image
The decline in inflation has also been fairly broad based, with now fewer than half of items seeing a pace of price growth above 3% -- although still a larger share than normal, which is ~0.3-0.4. Image
Read 7 tweets
Jan 16
Today's data: inflation!! 📈 Consumer prices were 3.4% higher in December than one year earlier. That's up from 3.1% in November.

I'll explore some of what's going on. #cdnecon #cdnpoli 🧵 www150.statcan.gc.ca/n1/daily-quoti…
Image
This is higher than last month, true, but it doesn't mean the inflation situation is worsening. I noted this yesterday, saying 3.4% was the number to watch.
This is a *very* important point to keep in mind for the next *several* months. Even if things are completely normal month-by-month, the headline rate won't fall much over the next quarter. Image
Read 9 tweets
Nov 21, 2023
As expected, inflation fell in October. A lot. From 3.8% in September to 3.1% in October. And monthly, adjusted for seasonality, prices were lower in October than Sept.

I'll unpack some more patterns here 🧵 #cdnecon #cdnpoli www150.statcan.gc.ca/n1/daily-quoti…
Image
A big part of the reason is from lower gasoline prices. That's anticipated because oil prices were down. There's a tight connection between energy's contribution to CPI and oil prices (obviously). This has been a consistent story over the past two years. Image
You can see the size of the contribution from energy to the change in inflation since September here 👇 . Basically everything else was a net wash. Image
Read 11 tweets
Nov 11, 2023
Some Alberta Pension Plan proponents are concerned about Albertans paying more in contributions than they receive in benefits. Is this "overcontribution" legitimate? If so, does it imply the CPP is unfair? Would an APP solve it?

Allow me to explain. 🧵🤓 #cdnpoli #ableg #cdnecon
The Government of Alberta regularly cites $60 billion in excess contributions over what has been received in benefits. The report commissioned by the government includes this figure. Red is Alberta. Positive means contributions > benefits. 👇 Image
The data are accurate. You don't even need an actuary. Statistics Canada reports this annually. Total contributions from 1966-2021 amount to approximately $60 billion. Adjusting for inflation provides a clearer perspective. Image
Read 14 tweets
Nov 4, 2023
To better understand this claim, consider an equally true but misleading statement: eliminating the GST would "reduce inflation by 61%"! 😲

Does that mean the GST is inflationary? What about the carbon tax?

I'll try to clarify things 🧵 🤓 #cdnecon #cdnpoli
The GST adds 5% to the cost of purchasing a good or service subject to this tax. Not all items are subject to it, though. I (roughly) estimate that, overall, the GST adds an average of 2.3% for consumer expenditures as a whole. (From here: )www150.statcan.gc.ca/t1/tbl1/en/tv.…
So, eliminating the GST would drop the CPI by 2.3%. Since the latest inflation reading is 3.8%, that would leave us at 1.5% (assuming nothing else changed). And 1.5% is 61% lower than 3.8%.

Simple. But not helpful or informative.
Read 10 tweets

Did Thread Reader help you today?

Support us! We are indie developers!


This site is made by just two indie developers on a laptop doing marketing, support and development! Read more about the story.

Become a Premium Member ($3/month or $30/year) and get exclusive features!

Become Premium

Don't want to be a Premium member but still want to support us?

Make a small donation by buying us coffee ($5) or help with server cost ($10)

Donate via Paypal

Or Donate anonymously using crypto!

Ethereum

0xfe58350B80634f60Fa6Dc149a72b4DFbc17D341E copy

Bitcoin

3ATGMxNzCUFzxpMCHL5sWSt4DVtS8UqXpi copy

Thank you for your support!

Follow Us!

:(