Ariel Karlinsky Profile picture
Apr 12, 2021 10 tweets 6 min read Read on X
Updated version of #WorldMortality by @hippopedoid and I is up on @medrxivpreprint.

doi.org/10.1101/2021.0…

Many updates, check it out.
Here are some highlights:

1
Our coverage increased from 79 countries and territories in the previous version to 89 and the time frame covered increased substantially, with many countries already reporting 2021 data.

2
We extended the introduction a bit, showcasing the vast historical usage of excess mortality in epidemiology - this method is not new at all and is extremely well established.

3
Some countries deaths counts are better than others, but our data is self-consistent as pre-covid 2020 deaths match well to 2015-2019 deaths and our 2020 forecast.

Could the true excess mortality be different there? Yes. But if anything, it's prob. HIGHER than our findings.

4
Our model for estimating excess deaths strikes the right balance between overly simplistic methods and more elaborate methods such as the Farrington model, and it allows estimation of CIs to asses statistical significance.

5
We have updated our "leaderboard" according to 4 different measures of excess mortality, each reveals a different dimension of the extent of COVID, excess deaths and the relation between them.

6
Even with more up to date data, countries without or with minor COVID spreads have experienced either mortality DEFICITIS (less than expected) or a statistically not-signficiant higher/lower counts (denoted as n.s.).

7
Since original upload, #WorldMortality is now incorporated to the excess deaths trackers of @OurWorldInData , @TheEconomist and @FinancialTimes and was covered extensively by the media in these outlets and more.

8
This version and the constant updates of our data and analysis would not be possible without the feedback, discussion and contributions of many people.

Latest data of #WorldMortality is always at: github.com/akarlinsky/wor…

And the latest analysis at: github.com/dkobak/excess-…

9/9
It's important no to extrapolate from incomplete data into now. Uruguay for example, has had almost no COVID deaths up to August (our latest data point), and even up to December, but has seen a steep rise since. Same for Czechia, which had no COVID and no excess up to October.

• • •

Missing some Tweet in this thread? You can try to force a refresh
 

Keep Current with Ariel Karlinsky

Ariel Karlinsky Profile picture

Stay in touch and get notified when new unrolls are available from this author!

Read all threads

This Thread may be Removed Anytime!

PDF

Twitter may remove this content at anytime! Save it as PDF for later use!

Try unrolling a thread yourself!

how to unroll video
  1. Follow @ThreadReaderApp to mention us!

  2. From a Twitter thread mention us with a keyword "unroll"
@threadreaderapp unroll

Practice here first or read more on our help page!

More from @ArielKarlinsky

Jul 12, 2023
Who and how many died in the 2020 Karabakh War?


@OrsolaTorrisi_ and I estimate the war led to ~6,500 excess deaths among people aged 15–49:
~2,800 in Armenia
~3,400 in Azerbaijan
and 310 in de facto Artsakh.

1
#poptwitter #AcademicTwitter https://t.co/ErFONCVT0ndoi.org/10.1007/s11113…


Deaths were highly concentrated among late adolescent and young adult males, suggesting that most excess mortality was directly related to combat.

2
For small countries like Armenia (pop ~3 million) and Azerbaijan (~10 million), such loss of young men represents a considerable long-term cost for future demographic, economic, and social development.

3
Read 7 tweets
Dec 14, 2022
Our paper on @WHO excess mortality associated with Covid-19 now on @Nature:
nature.com/articles/s4158…

Please read it and the associated coverage, we aimed to make it as sound and widely understandable as possible.

some important highlights:

#poptwitter #epitwitter #econtwitter Image
It's often argued that in the absence of all-cause-mortality data to directly estimate excess deaths, we should rely on the officially reported covid-19 data. This is false, as we explain here Image
It is high time that countries, regions and the world report all-cause-mortality in (as close to) real time as possible.
This will help prevent future outbreaks from evolving to an epidemic and then a pandemic.
Vital Registration is VITAL. Image
Read 5 tweets
Sep 29, 2022
I have officially submitted a request to retract Motallebi et al (2022) from @AmJPrevMed.

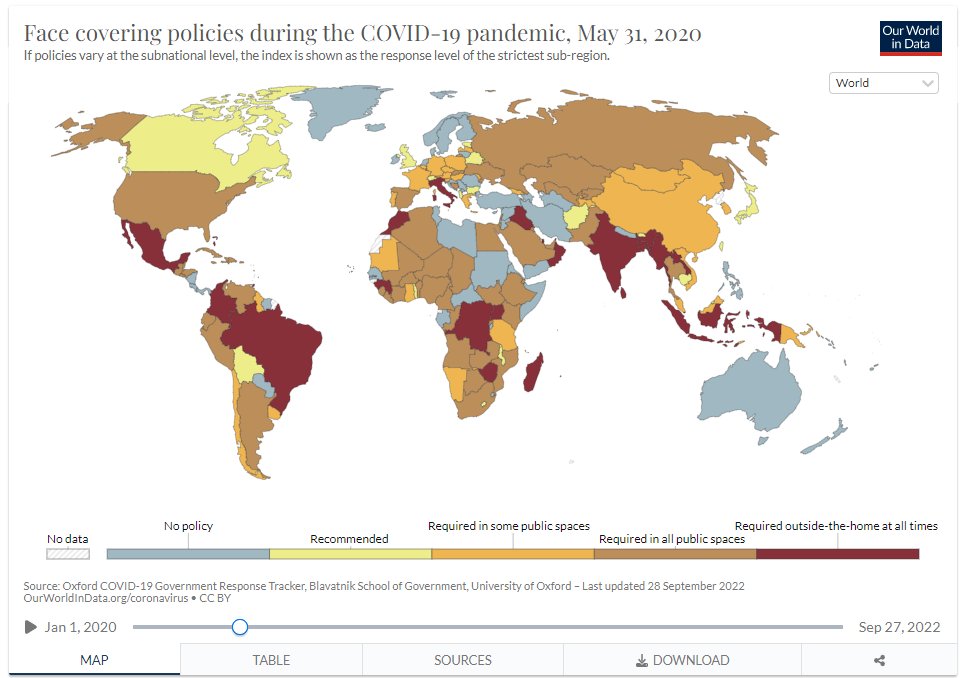
There are many conceptual and practical issues with the analysis, but the most important one is miscoding of countries into "masking yes/no" groups.

1
The paper codes Belgium, France, Italy, Spain, UK into the "no masking policy" group during the 1st COVID wave.

This is plainly false, not just by examining data on masking policies but by anyone who lives in or was in Italy for example.

2
Another issue is that the study essentially compares countries that had COVID during the 1st wave to countries without, wrongly attributing difference in deaths to policy...

3
Read 7 tweets
Sep 28, 2022
This is a terrible study.
The sample period is only February 15 to May 31st 2020.

Many countries in the "yes mask policy" are countries with literally NO COVID SPREAD (as evident from both reported cases/deaths and lack of excess mortality)...

1 ImageImageImageImage
that were badly hit when covid actually came.

Many countries in the "no mask policy" are outright bizarre: Belgium, France, Italy, Spain...

This is contradicted by the supposed source of data! Image
Look, I think face coverings are important for an airborne pathogen and stricter adherence might have prevented large outbreaks, death and misery.

But "80% reduction in DEATHS due to mask policies" is BULLSHIT.
This is a really shoddy research.
@GidMK @K_Sheldrick
Read 5 tweets
Aug 23, 2022
#PreliminaryMortality update:

United Arab Emirates: 2020-2021 information from several emirates.

Costa Rica: First half of 2022 data.

github.com/akarlinsky/wor…
PM contains data which doesn't fit into World Mortality or Local Mortality for various reasons such as time format (not weekly, monthly or quarterly), un-official status, projections, early releases of more detailed data forthcoming, etc.
Each datum source, properties and limitations is listed below. As the time format varies substantially, each source is provided as a separate csv file.
Read 5 tweets
Aug 23, 2022
אני רואה ששוב ושוב מפיצים את התרשים מהמחקר שלנו בנוגע להתחלקות הוצאות מדינה ומיסים על פני משקי בית בישראל.
זה מאוד מחמם את הלב אבל אשמח אם תזכרו שהוא טרם פורסם ועד ייתכנו בו שינויים, אם כי התמונה הגדולה לא תשתנה הרבה.

1 Image
אישית אני חושב שזה אחד המחקרים החשובים ביותר שעבדתי עליהם ואני שמח לראות שיש לו תהודה גדולה עוד לפני שפורסם.

מאז שעזבתי את קהלת לכבוד הדוקטורט לקחו את המושכות שלו ביתר חבריי לפורום ולגבי השאלה "מתי תפרסמו" התשובה היא "when it's ready".

2
הסבר קטן לגבי מה רואים פה:
המחקר אומד על בסיס סקר הוצ' משק הבית את תשלומי משקי הבית על מס הכנסה, דמי ביטוח לאומי ובריאות (גם "חלק מעסיק", שאינו מופיע ישירות בסקר ונאמד בעזרת ההכנסה ברוטו מעבודה ולוחות הניכוי של המוסד לבט"ל)...

3
Read 7 tweets

Did Thread Reader help you today?

Support us! We are indie developers!


This site is made by just two indie developers on a laptop doing marketing, support and development! Read more about the story.

Become a Premium Member ($3/month or $30/year) and get exclusive features!

Become Premium

Don't want to be a Premium member but still want to support us?

Make a small donation by buying us coffee ($5) or help with server cost ($10)

Donate via Paypal

Or Donate anonymously using crypto!

Ethereum

0xfe58350B80634f60Fa6Dc149a72b4DFbc17D341E copy

Bitcoin

3ATGMxNzCUFzxpMCHL5sWSt4DVtS8UqXpi copy

Thank you for your support!

Follow Us!

:(