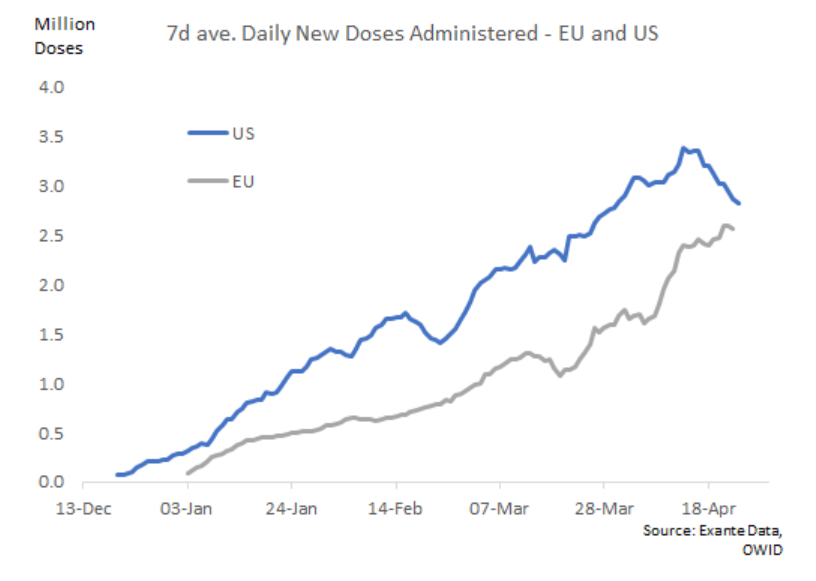
My tweet from yesterday has generated A LOT of debate. In fact, almost 1 million people have looked at the basic chart I circulated (showing with EU catching up to the pace of vaccine administrations the US first achieved in March).

It has also generated some misinterpretation. I did not mean to imply that any country was ‘winning’ against any other country. In this battle, it is all countries against the virus, and we should all celebrate when more countries join the winning side.
In terms of what it means to be ahead, clearly it is not just about a good pace for a few days. It is about the speed at which you can reach a critical level of overall immunity in the population; at which put the virus will be on a sustained declined (including after reopening).
I would say the following. The key criteria for 'winning' is vaccinating enough of the population that the virus is firmly on the back-foot (Rt < 1 if you will). Israel achieved that in early February. UAE achieved in March, and the US arguably achieved it during April.
In general, when doses administered amount to 40-60% of the population, there is evidence points to a turning point, meaning that reopening can happen while the virus is still on the decline. Image
If the EU countries deliver vaccines in the region 1% of the population per day over the coming months (which we have hit on peak days recently), we should see overall doses jump from around 30-35% currently to 60% or above by end-May.
Once the EU countries get into that 40-60% zone, which have proved a turning point for other countries (including essentially all US states), we should start to see clear results, allowing broad-based re-opening.

At that point, the EU will be clearly on the winning side of the virus battle too. Extrapolating the current vaccine trajectory (assuming no fresh setbacks) we should get there in 4-6 weeks.

END

• • •

Missing some Tweet in this thread? You can try to force a refresh
 

Keep Current with Jens Nordvig

Jens Nordvig Profile picture

Stay in touch and get notified when new unrolls are available from this author!

Read all threads

This Thread may be Removed Anytime!

PDF

Twitter may remove this content at anytime! Save it as PDF for later use!

Try unrolling a thread yourself!

how to unroll video
  1. Follow @ThreadReaderApp to mention us!

  2. From a Twitter thread mention us with a keyword "unroll"
@threadreaderapp unroll

Practice here first or read more on our help page!

More from @jnordvig

26 Apr
Here is an important chart. It has changed a fair bit over the past month, and I am not sure everybody has internalized it.

The EU is closing the gap to the US in terms of vaccine administrations. Image
I know the EU has somewhat higher population and the J&J pause may have impacted the US numbers more (and temporarily), and that demand may be an increasing issue in the US.

But the numbers are what the numbers are in the aggregate, and the EU roll-out has accelerated notably.
Further, the EU roll-out can probably accelerate further, as J&J comes fully online and Pfizer/BioNTech scales up deliveries more.

Things will look different by May...
Read 4 tweets
15 Apr
US 10Y yields are up 70bp on the year, after retracing some over the last few weeks.

How is the alleged EM taper tantrum going? (4 tweet thread)
It is a mixed bag, not all EMs are the same, but the most liquid crosses are interesting. Starting with South Africa:

the ZAR is appreciating strongly in recent week, and now clearly at a new post-COVID-shock high vs the USD (=USD at the lows...)
The MXN saw some volatility in Feb and early March, but is quickly approaching the strongest post-covid-shocks levels again, as seen in January
Read 5 tweets
13 Mar
Should the Fed lie?

Some argue that showing 2023 rate liftoff at the March 17 FOMC would be counter-productive, and that it would be better to manipulate the dots lower to strengthen the forward guidance.

Is lying sound central bank communication?
On the one hand, the Fed is trying hard to be accommodative, and the new core element in the Fed's framework is not to be preemptive, and instead wait for realized (inflation) outcomes, before embarking on tightening. Hence, you want low dots.
On the other hand, some FOMC participants may indeed think that inflation will hit their objective (2%, and on a path to exceed it) within the forecast horizon. Hence, you can argue, within the framework, that it is logical then to show 2023 lift-off in that scenario.
Read 13 tweets
21 Jan
I will add this (based on the comments):

A) The ownership structure of bitcoin is special. Institutions (hedge funds etc) have only gotten involved recently, and not in size yet. This is the reason there is no portfolio contagion, bitcoin selloffs do not create 'enough damage'.
B) as more institutions get involved (as all indicators are that they will during this year) the position size and relevance to institutional portfolios will grow. And then portfolio contagion is also likely to increase.
B2) It is even possible/likely that increased portfolio contagion will impact correlations, creating a more positive correlation to other risk assets (think SPX), and this could indeed be self-fulfilling, as higher correlation will mean more portfolio contagion.
Read 4 tweets
20 Jan
We have a new substack out by @GeneralTheorist which digs into the core concepts of money supply, contrasting money expansion under QE (via the banking system) with digital currency (CBDC) provided directly to the public.

moneyinsideout.exantedata.com/p/the-mechanic…
This may seem like an academic debate, and the presentation here is indeed conceptual. But central bank digital currency is potentially just around the corner in some jurisdictions. Hence, it is important to know how it can fundamentally alter the nature of monetary policy.
Digging into the accounting of digital currency also again highlights why 'asset swap QE' has such limited potency (outside a financial crisis). Digital currency provision blurs the border to fiscal policy, and that raises important legal issues, around central bank independence.
Read 4 tweets
30 Dec 20
When I think about a country with testing issues, I think about Mexico, which has had a very high positivity ratio for its COVID testing through the entire pandemic (around 50%). But many US states are now seeing positivity rates really spike too, not far behind Mexico...
The trend higher in positivity rates / hit ratios (blue lines) are partly a function of less testing over the holidays. But it is still telling:

Arizona: >40% hit rate / positivity
Idaho >50% hit rate / positivity
Read 8 tweets

Did Thread Reader help you today?

Support us! We are indie developers!


This site is made by just two indie developers on a laptop doing marketing, support and development! Read more about the story.

Become a Premium Member ($3/month or $30/year) and get exclusive features!

Become Premium

Too expensive? Make a small donation by buying us coffee ($5) or help with server cost ($10)

Donate via Paypal Become our Patreon

Thank you for your support!

Follow Us on Twitter!