1/ Today we are looking at @AaveAave liquidation stats on the Ethereum mainnet. The rest of the week we will flex the @Covalent_HQ API and look cross-chain over to some Aave stats on @0xPolygon.
This first visual shows a breakdown of the top 50 liquidators active on V1.
This first visual shows a breakdown of the top 50 liquidators active on V1.

2/ Keep in mind that the top liquidator has only performed about $13M in liquidations and receives a profit between 5%-15% depending on the asset. Meaning profits (before gas) max out at $1.95M for the top-earning liquidator.
We can dig into exact numbers if needed.
We can dig into exact numbers if needed.
3/ Before going any further let's hit some quick facts:
Max profit all-time (before gas): $3.6M
Largest Liquidation: $9,094,369
Average Liquidation: $40,949
Median Liquidation: $3,037
Total Aave Liquidations: 4,757
Max profit all-time (before gas): $3.6M
Largest Liquidation: $9,094,369
Average Liquidation: $40,949
Median Liquidation: $3,037
Total Aave Liquidations: 4,757
4/ Getting back to V2, we also see a high skew towards the top - likely because it has become uneconomical to liquidate smaller positions due to high gas costs, forcing some consolidation.
Max profit before gas fees is $3.6M on V2. We could dig into exact numbers if needed.
Max profit before gas fees is $3.6M on V2. We could dig into exact numbers if needed.

5/ Naturally the next place to look is the users being liquidated. This visual shows the top 50 users that have had positions liquidated. Keep in mind they only have to pay a fee between 5%-15% and they can keep the debt that is covered by the liquidator.

6/ Looking to V2, we see a similar chart. The max possible penalty of 15% on the total $20M liquidated means that this top user could have paid roughly $3M in penalties.

7/ It would have been interesting to see an address that is both a top liquidator and a top user being liquidated - but this is not the case.
That is as far as we looked into it for now but if there is interest we can dig further into who these users are.
That is as far as we looked into it for now but if there is interest we can dig further into who these users are.
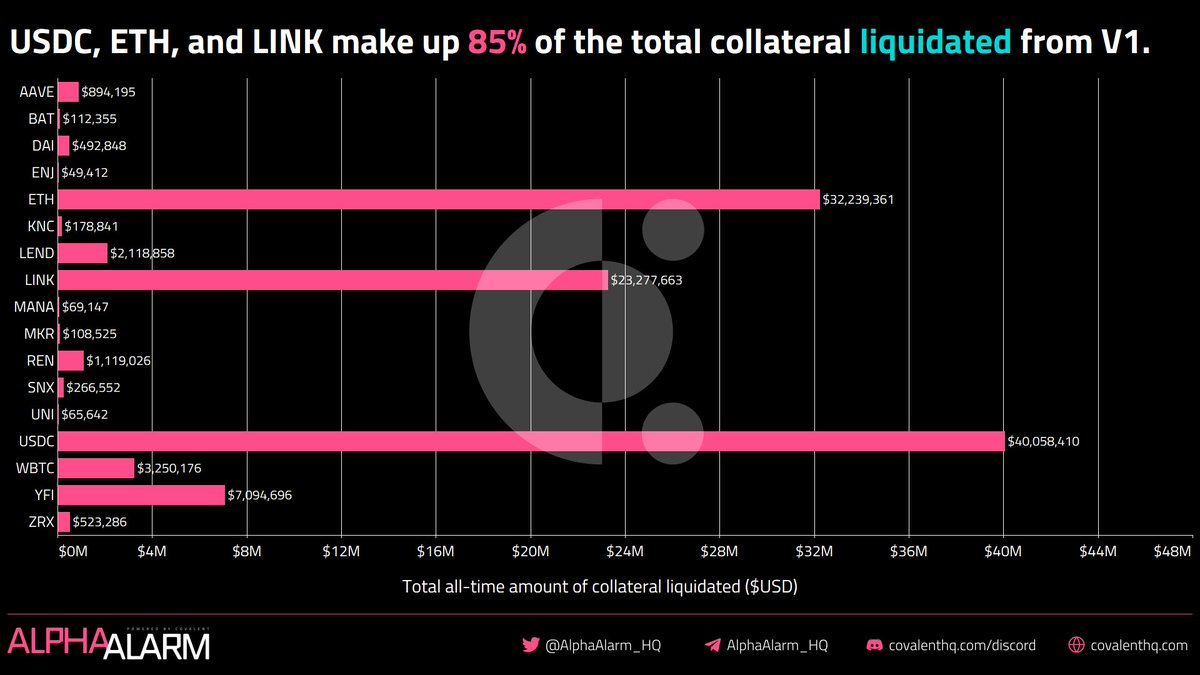
8/ Now let's have a look at the assets being used in this process.
The top collateral asset liquidated on @AaveAave V1 is $USDC with over $40M. Combined, the top 3 assets make up 85% of total liquidations on V1.
The top collateral asset liquidated on @AaveAave V1 is $USDC with over $40M. Combined, the top 3 assets make up 85% of total liquidations on V1.
9/ Interestingly, V2 shows a different picture with $WETH and $WBTC making up the large majority of liquidations.

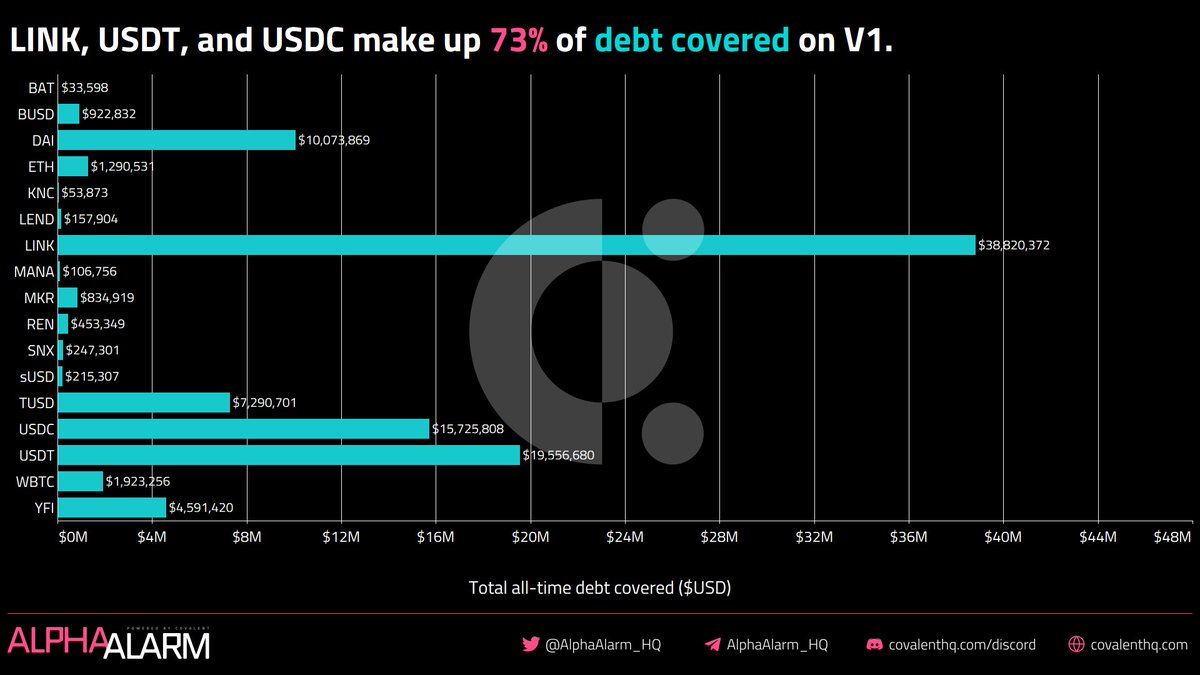
10/ What about the debt being covered in these liquidations? On V1, the top asset being covered is $LINK. With stablecoins $USDT and $USDC following a ways behind.
11/ The debt covered on V2 is more in line with what you would expect. The top 3 are all stablecoins and $USDC makes up 60% of it.

12/ If you made it this far, you might be curious about when all of this is happening. Liquidations happen rather sporadically (as you would expect) and are triggered by large price fluctuations. Sometimes these fluctuations are caused by exploits and other large events.
13/ This visual shows the V2 liquidations following the large $BTC price drop on April 18th. It was the largest day for liquidations that @AaveAave has ever seen. Most of the action happened on V2 though because of the $WBTC support (no $WBTC on V1).

14/ For reference, here is what V1 looks like over its notable history. There is a large spike on August 8th accounting for roughly 22% of V1 liquidations.

15/ Thanks for hanging on and making it through my book.
Do you like the longer and more detailed analyses or do you fancy the short and sweet ones?
Do you like the longer and more detailed analyses or do you fancy the short and sweet ones?
• • •
Missing some Tweet in this thread? You can try to
force a refresh