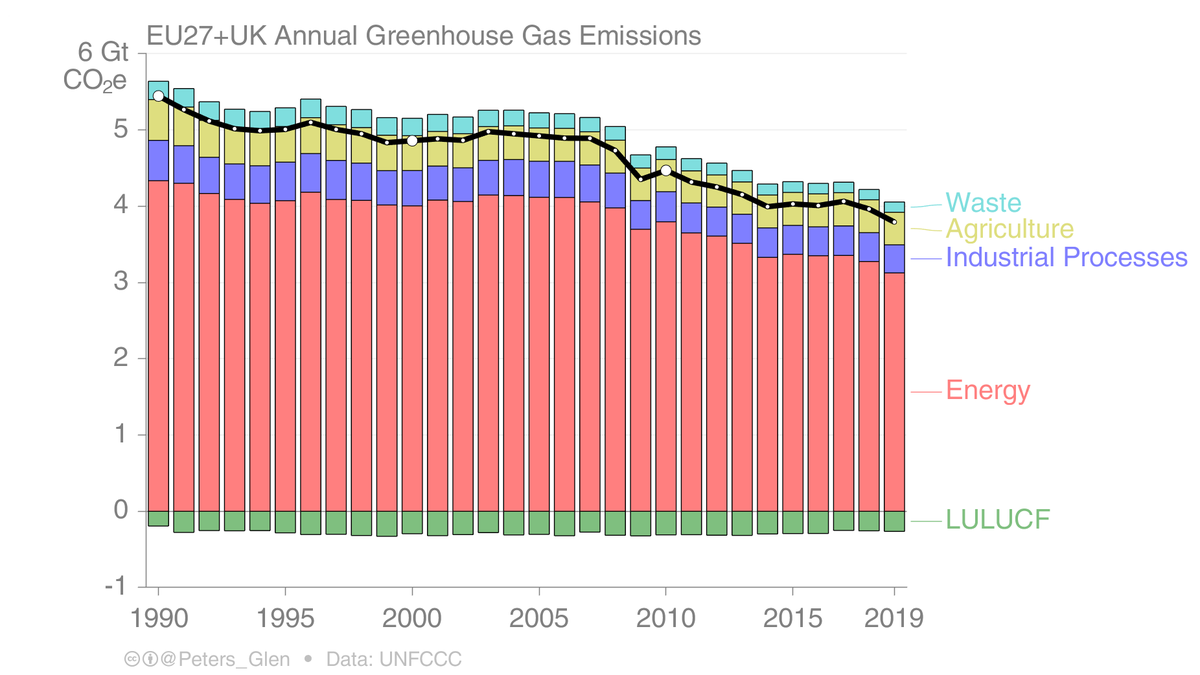
EU27+UK GHG emissions (including LULUCF) have declined 30% from 1990 to 2019.

By changes by sector were:
* Energy: -28%
* Industry: -30%
* Agriculture: -20%
* Waste: -44%
* LULUCF: +37% (stronger sink)

1/
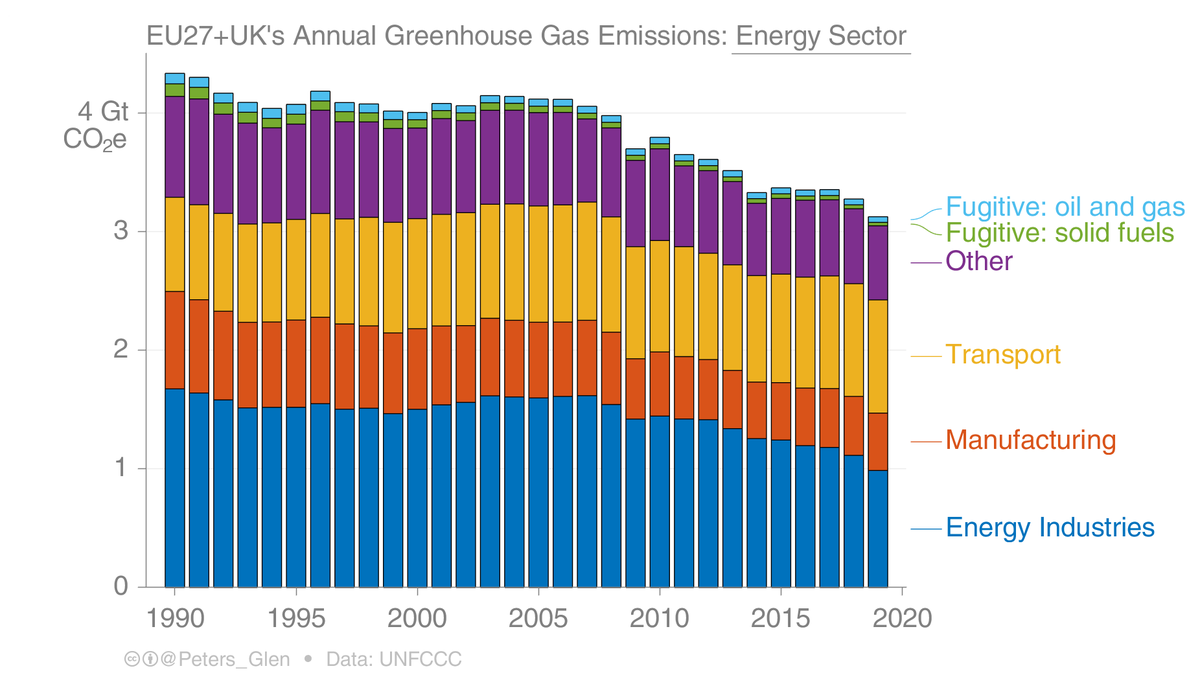
The energy sector is the largest in terms of GHG emissions.

The changes from 1990 to 2019 were:
* Energy industries: -41%
* Manufacturing: -41%
* Transport: +20%
* Other (buildings, etc): -27%
* Fugitive: solid -73%, oil/gas -46%

Transport is a problem...

2/
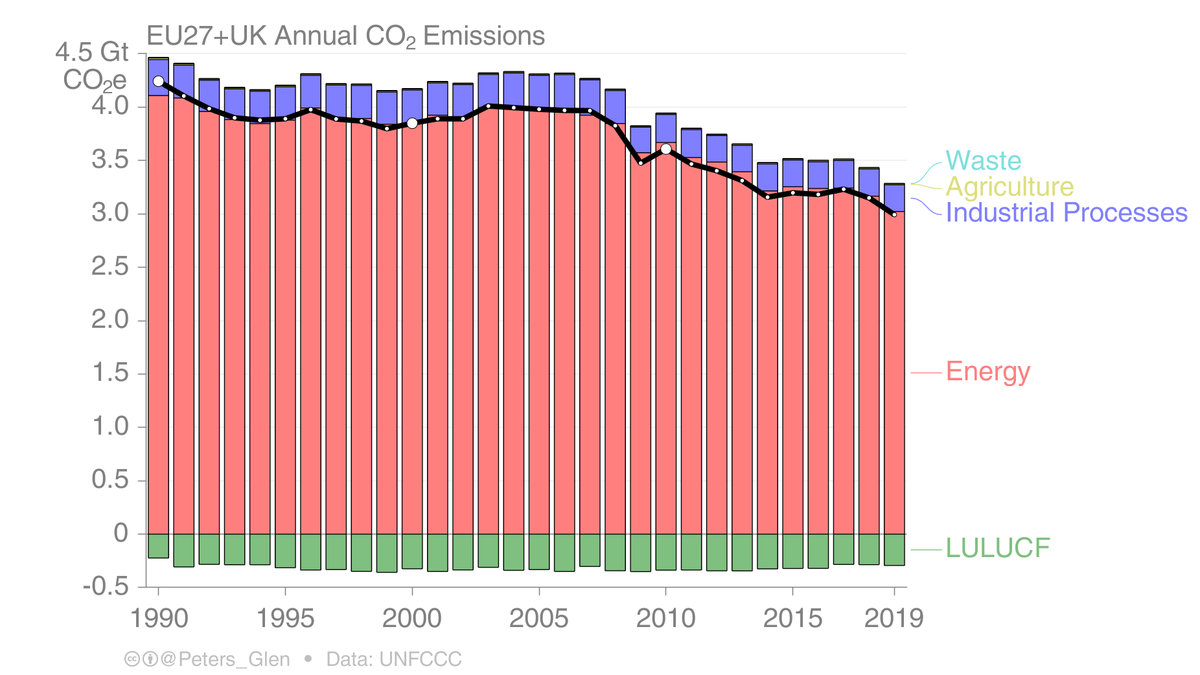
Considering only CO₂ emissions, emissions are nearly totally dominated by energy (see previous tweet for details), with some emissions from industrial processes (cement, etc) and LULUCF as a sink.

3/
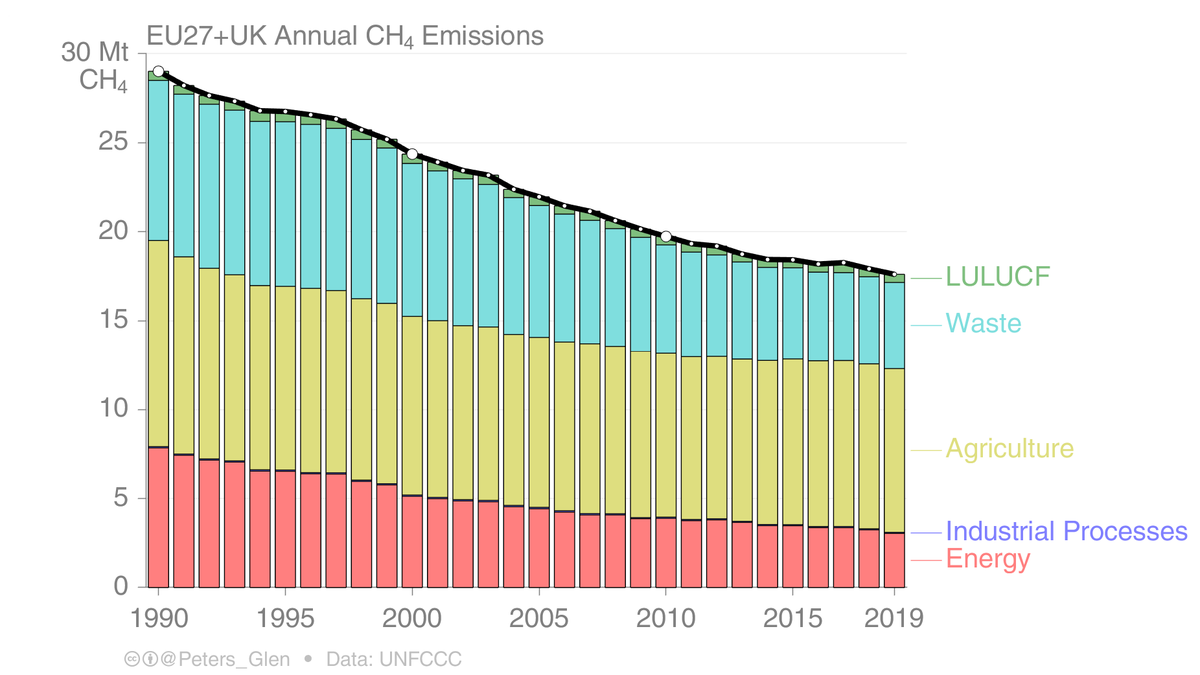
CH₄ emissions have gone down 40% from 1990 to 2019, by sector:
* Energy: -61%
* Agriculture: -21%
* Waste: -46%

This shows that big reductions can be made for CH₄, it is more than burning cows...

4/
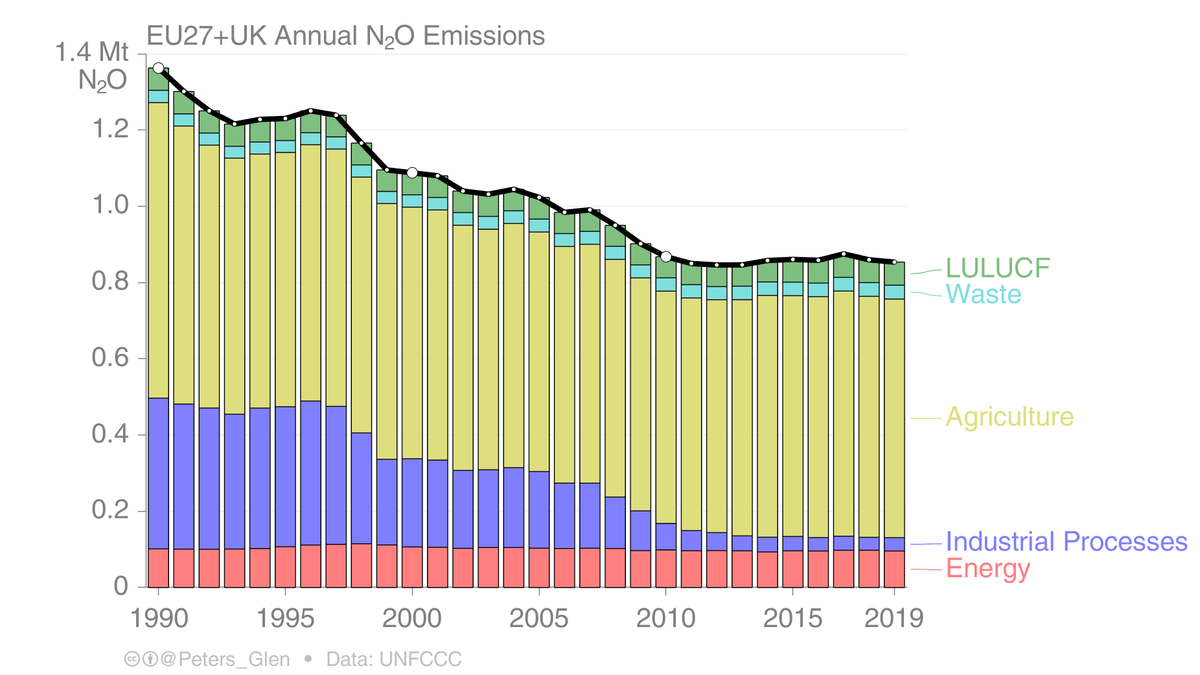
N₂O emissions have gone down 37% from 1990 to 2019, by sector:
* Energy -5%
* Industry: -90%
* Agriculture: -19%
* Waste: +12%
* LULUCF: +4%

Again, N₂O reductions can be made, particularly in industry. It is not just agriculture...

5/
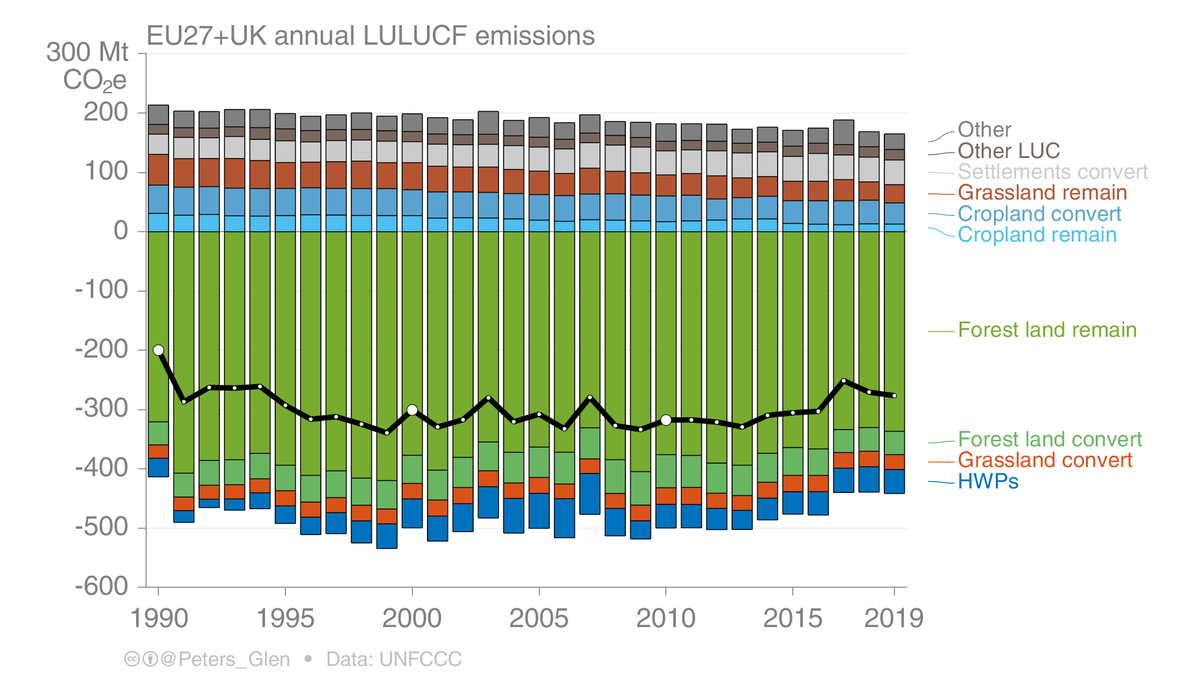
Finally, the most complex sector, LULUCF, where there are both emissions & removals.

The biggest removals are from forests that remain forests (managed forests). Some of this will be management, some will be CO₂ fertilisation & climate (ie, luck).

Lots of other dynamics...

6/
That was the EU27+UK GHG emissions in a nutshell.

Lots more data to dig into, this is just a summary found in the UNFCCC submitted emission inventories. And there are about 40 countries with this data (Annex I).

Let me know what data you would like to see...

7/7
*burping...
My apologies for burning the cows in tweet 4, I only meant them to burp...

• • •

Missing some Tweet in this thread? You can try to force a refresh
 

Keep Current with Glen Peters

Glen Peters Profile picture

Stay in touch and get notified when new unrolls are available from this author!

Read all threads

This Thread may be Removed Anytime!

PDF

Twitter may remove this content at anytime! Save it as PDF for later use!

Try unrolling a thread yourself!

how to unroll video
  1. Follow @ThreadReaderApp to mention us!

  2. From a Twitter thread mention us with a keyword "unroll"
@threadreaderapp unroll

Practice here first or read more on our help page!

More from @Peters_Glen

4 May
Mitigation will cause the ocean sink to have reduced efficiency because of:
* reductions in carbonate buffer capacity in scenarios with intermediate or no mitigation
* reduced transport of anthropogenic carbon from surface to depth in 1.5°C scenarios.

1/
bg.copernicus.org/articles/18/27…
2. Atmospheric CO₂ has grown exponentially over the industrial era. Under an exponential forcing regime, ocean anthropogenic carbon uptake also grows exponentially.
3. Since these conditions have held over the historical era, the ocean sink has historically maintained a high efficiency.

In future scenarios, regardless of the degree to which emissions are mitigated by 2080, efficiency of ocean anthropogenic carbon uptake will decline.
Read 4 tweets
3 May
Mitigation scenarios based on the Shared Socioeconomic Pathways (SSPs) are designed to have a certain radiative forcing in 2100. Pathways to 2100 differ.

Since they are based around MAGICC, they all converge to the RCP level in 2100 (other models may give different forcing).

1/ Image
The radiative forcing is dominated by CO₂. The large spread in CO₂ means there is a range in "remaining carbon budgets".

The two bold lines are the 'marker' scenarios used in Earth System Models, all thin lines are similar scenarios from different energy-system models.

2/ Image
The differences between total & CO₂ forcing is non-CO₂. From the peak around 2030-2040, non-CO₂ forcing causes a declining temperature trend (from non-CO₂ components).

The two marker scenarios are low, meaning larger carbon budgets.

3/ Image
Read 5 tweets
1 May
Cumulative CO₂ emissions explain most future global warming, assuming sufficient action on non-CO₂.

Distributing a remaining carbon budget of 500GtCO₂ with a linear decline (black) leads to net-zero ~2045.

Depending on short-term action, many net-zero years are possible.

1/
If emissions decline exponentially, also in the 'Raupach curve', net-zero emissions never occur & the remaining carbon budget is never exceeded. Net-zero is not a necessity, but a modelling outcome.

The 'Raupach curve' is explained here: iopscience.iop.org/article/10.108…

2/
Most scenarios are based on cost-optimisation to a 2100 target, which means the temperature can peak & decline, overshooting the 2100 target before returning to it by 2100.

These scenarios are where the net-zero ~2050 come from (2059 in this figure).

3/
Read 5 tweets
30 Apr
Climate models show that global warming stops when CO₂ 𝐞𝐦𝐢𝐬𝐬𝐢𝐨𝐧𝐬 reach zero (blue).

This is often confused with the warming that occurs if CO₂ 𝐜𝐨𝐧𝐜𝐞𝐧𝐭𝐫𝐚𝐭𝐢𝐨𝐧𝐬 are kept constant (red).

Years of confusion explained by @hausfath

1/
carbonbrief.org/explainer-will…
2. The Earth is out of thermal equilibrium, with the excess energy taken up by the ocean. As equilibrium is reached, the surface temperature rises (red).

If emissions go to zero, the CO₂ concentration declines, leading to a smaller energy imbalance & less warming (blue).
3. Despite the non-linearities, these two factors almost perfectly cancel!

In the very long run – over many hundreds to thousands of years – carbon sinks become dominant & global temperatures would eventually fall – as long as anthropogenic CO₂ emissions remained at zero.
Read 7 tweets
29 Apr
"Human-caused climate warming stops when humans stop adding CO₂ to the atmosphere, & emissions of other greenhouse gases are declining sufficiently" (text from @KA_Nicholas)

A THREAD on a recent presentation on net-zero emissions...
slideshare.net/GlenPeters_CIC…
2. The near-linear relationship between global warming & CO₂ emissions allows a remaining carbon budget to be defined.

This remaining carbon budget can be distributed over time in many different ways, leading to different 'net-zero' years.
3. It is possible to distribute the remaining carbon budget in a way that it never goes below zero (the brown area is the remaining carbon budget).

This is a simplification of reality, but a helpful comparison to other pathways.
Read 12 tweets
28 Apr
🧵 on alternatives to "net-zero"

"CO₂-induced global warming stops when anthropogenic CO₂ emissions balance with anthopogenic CO₂ removals"

is a long version of

"CO₂-induced global warming stops with (net-)zero CO₂ emissions"

1/
In short-form: "...emissions balance with removals"

In long-form: "anthropogenic emissions from sources balance with anthropogenic removals from sinks"

I have basically used UNFCCC language, not IPCC language. These policy makers had it right all along!

2/
Twitter was very divided on zero versus net-zero. Though, there are many reasons. Clearly, science & policy are getting blurred here. Many say "zero" because "net" means continued use of fossil fuels.

I suspect technically, "net" is more correct, but not sure 100% correct.

3/
Read 9 tweets

Did Thread Reader help you today?

Support us! We are indie developers!


This site is made by just two indie developers on a laptop doing marketing, support and development! Read more about the story.

Become a Premium Member ($3/month or $30/year) and get exclusive features!

Become Premium

Too expensive? Make a small donation by buying us coffee ($5) or help with server cost ($10)

Donate via Paypal Become our Patreon

Thank you for your support!

Follow Us on Twitter!