John Roberts Profile picture
May 13, 2021 11 tweets 4 min read Read on X
A summary thread of the latest #REACT survey from @imperialcollege on England infectivity.

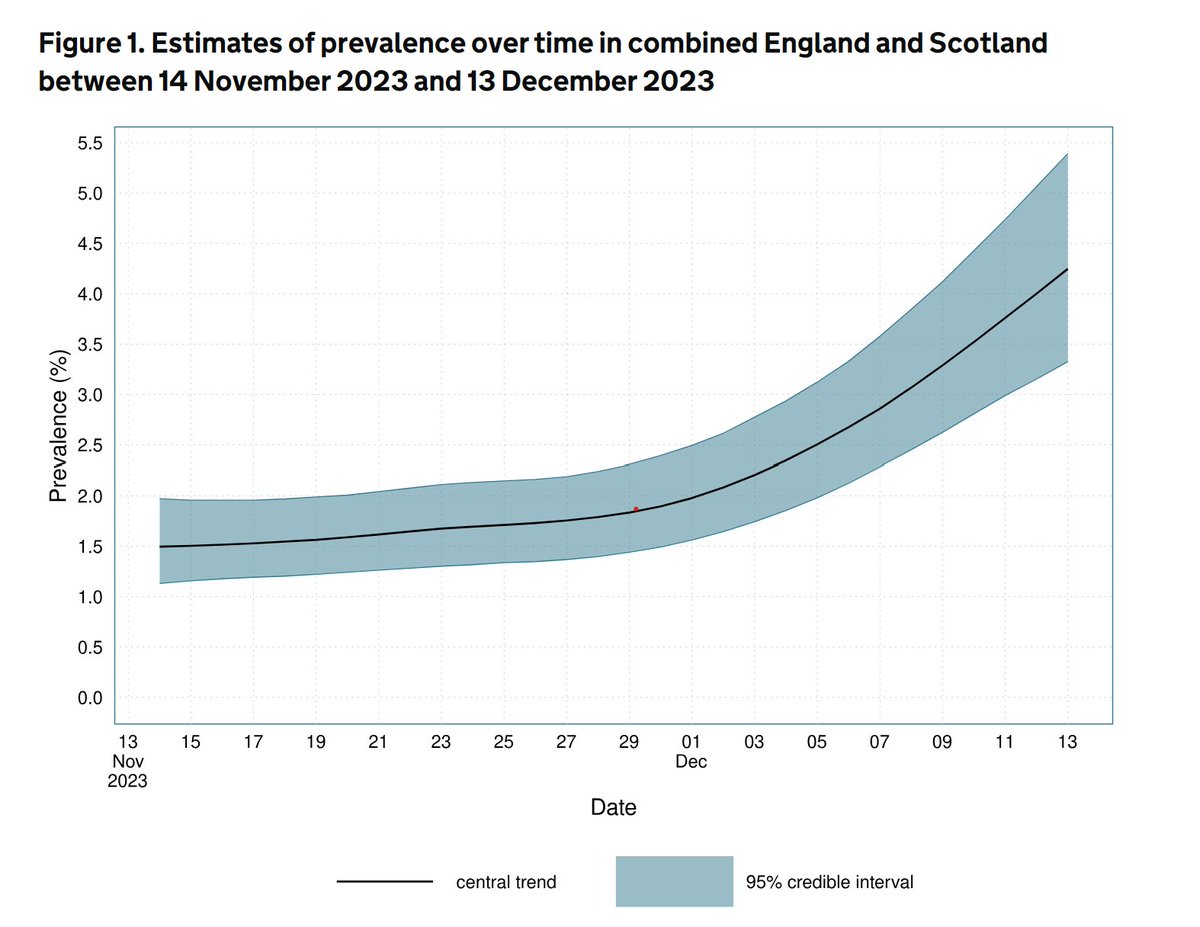
The headline is very good news, prevalence has halved since the last round, falling from 0.20% to 0.10%, with R at 0.9 between the rounds.

Round 11 is between April 15 and May 3.

1/
115 positive samples were obtained from 127k tests. Note the slightly lower number of tests this round, which the report notes is due to a lower response rate, suggesting a lower interest in participants as the situation improves.

2/
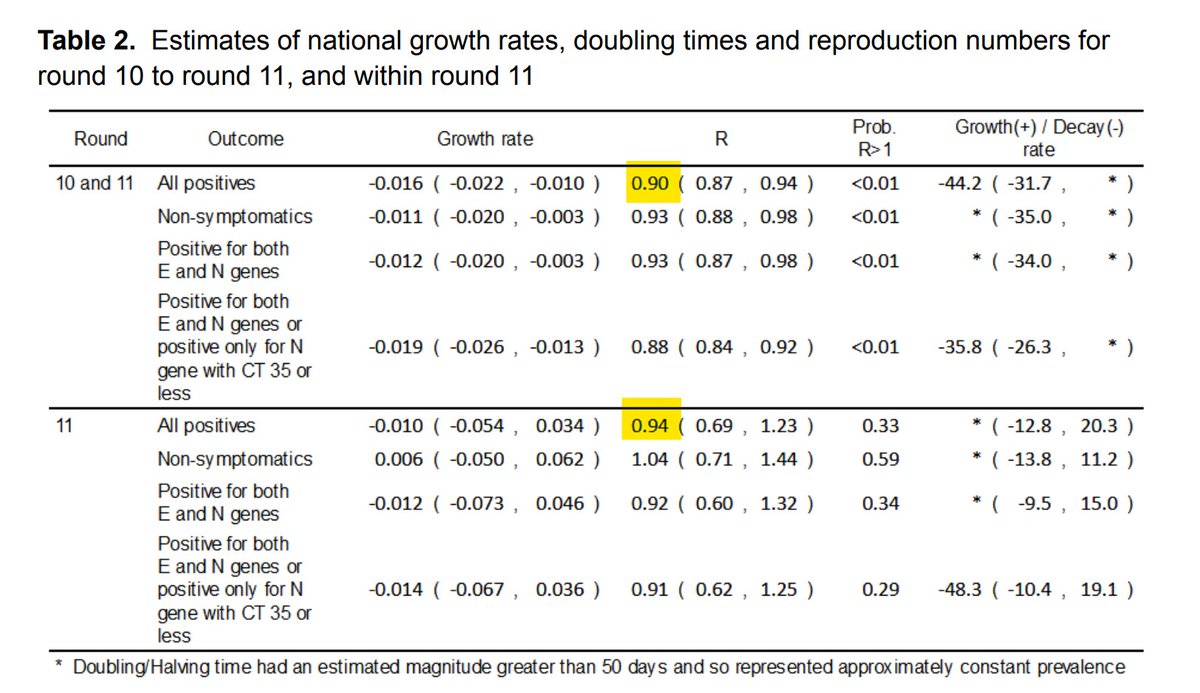
Between rounds, R is put at 0.9, though slightly higher at 0.94 within the round. This is consistent with recent SAGE views, and not unexpected as the lockdown restrictions are gradually eased.

3/
By region, the SE is the only area to show an increase between R10 and R11. Although the CI's are wide, it's considered that there is a very high probability that the underlying situation is of R being greater than 1.

4/
By age, there's a similar situation with the 25-34 age groups of a small overall increase, now at 0.21% double the overall figure.

The biggest fall has been a two thirds fall in the 55-64 group, likely reflective of that group acquiring vaccine protection between the rounds.
5/
It's great to see the clear disconnect between deaths (in red) and prevalence since mid January, clearly showing that even if infected, the vaccine prevents serious illness and death.

6/
There's an effect on hospitalisations too, but it's much less marked, consistent with predictions made as the roll-out started that deaths would fall faster than hospitalisations.

7/
The report notes the presence of B.1.617.2 in around 7.5% of the cases for which a lineage could be identified, although this is only 2 out of 26 samples. The remainder were B.1.1.7.

8/
Note that REACT is a randomly sampled survey, which is the best way to ensure a true representation of the population, and which isn't affected by factors such as number of available tests.

9/
As one example, the vaccine may be increasing the proportion of cases which are asymptomatic. These are less likely to be picked up by PHE testing, or by surveillance methods reliant on self-reporting.

10/
So it is one of several methods of measuring the level and direction of prevalence, all of which have their benefits and weaknesses, and which should be considered in the whole rather than individually to assess the current position of the pandemic.
spiral.imperial.ac.uk/bitstream/1004…
11/END

• • •

Missing some Tweet in this thread? You can try to force a refresh
 

Keep Current with John Roberts

John Roberts Profile picture

Stay in touch and get notified when new unrolls are available from this author!

Read all threads

This Thread may be Removed Anytime!

PDF

Twitter may remove this content at anytime! Save it as PDF for later use!

Try unrolling a thread yourself!

how to unroll video
  1. Follow @ThreadReaderApp to mention us!

  2. From a Twitter thread mention us with a keyword "unroll"
@threadreaderapp unroll

Practice here first or read more on our help page!

More from @john_actuary

Mar 15
A great thread on the state pension and National Insurance.

For me, the trailed abolition of NI and thus its replacement by general taxation in terms of funding state pension benefits will have a major generational redistribution of tax.

1/
It’s been the case that (in aggregate) at any one time the working generation funds the SPs of the retired generation above it.

2/
If the abolition of NI results in an increase (albeit smaller - else why bother) in income tax, whilst those in work will in total be better off, pensioners will be worse off.

3/
Read 9 tweets
Feb 7
The Pensions & Lifetime Savings Association has updated its guide to living costs in retirement. The full report is well worth a read, and goes into a lot of detail.

1/

retirementlivingstandards.org.uk/2023_research_…
Image
One key point is that it assumes that pensioners own their home outright - probably reasonable now, but the shift to renting means that in future years that may become increasingly questionable.

2/
It focuses on retirement income, but note that other sources may be used to fund retirement, whether it be income from savings/investments, or gradual withdrawal of capital. Much more likely to be relevant for those aspiring to a comfortable lifestyle of course.

3/
Read 7 tweets
Dec 21, 2023
UKHSA estimates that prevalence of COVID in England and Scotland has nearly tripled in the month since the ONS restarted its COVID infection surveillance.

1/

gov.uk/government/sta…
Image
Fortunately prevalence is lowest at the oldest, more vulnerable age groups, but is estimated at just under 6% in the 18 to 44 age groups.

2/ Image
Prevalence is estimated to be highest in the London area, at just over 6% across the population. Note though that confidence intervals are wider due to lower sample sizes than in previous studies.

3/ Image
Read 4 tweets
Sep 12, 2023
So with the news this morning that the earnings growth announced today means the state pension (SP) will very likely increase by another 8.5% next year, it's time to set out once again why the SP triple lock (TL) is such a bad idea.

1/ Image
It's all down to cherry-picking the best of the three rates each year. I did a thread nearly a year ago, that hopefully sets out clearly how the mechanism inevitably means that the SP will grow over time against both earnings (E) and prices (P).

2/
Visually, you can easily see how that cherry picking works in practice with this great chart from the FT.

The effect is greatest when one index lags the other by a large amount in one year, and then catches up in the next year.

3/ Image
Read 17 tweets
May 31, 2023
With BH's still distorting individual weeks' figures, the cumulative position gives a better view, with the latest CMI age-standardised analysis showing mortality 3.8% (of a full year's mortality) worse than its reference year of 2019.

1/
That 3.8% of a full year's mortality translates to an excess of 9.3% of YTD expected mortality, or over 21,000 excess deaths.

Bear in mind that pre-pandemic, you'd expect mortality 4 years later to be noticeably lower, due to the previous improving trend.

2/
The 9.3% excess is split 50/50 into "with COVID" deaths (where it was listed as a contributory factor on the death cert), and others.

Over 10,500 registrations in 2023 have had COVID listed as a cause - around two thirds of which it's put as the underlying factor.

3/
Read 5 tweets
May 13, 2023
A great example of how @ABridgen will RT any old rubbish, despite how absurd the numbers look, if they fit the anti-vax narrative he is now pursuing.

Even the original poster has now admitted that the figures were completely wrong and deleted the post.

1/
Here's the mea culpa - it was only wrong by a factor of 13, but at least the post has been deleted rather than just corrected and left up, when experience shows that only a fraction of the original audience will see the correction.

So what are the true numbers?

2/ Image
In E&W the peak week in 2020 was just under 9,000, and the second wave peak was pretty close to that number.

In total ONS has recorded 199,728 COVID related deaths in E&W since the pandemic started.

3/ Image
Read 8 tweets

Did Thread Reader help you today?

Support us! We are indie developers!


This site is made by just two indie developers on a laptop doing marketing, support and development! Read more about the story.

Become a Premium Member ($3/month or $30/year) and get exclusive features!

Become Premium

Don't want to be a Premium member but still want to support us?

Make a small donation by buying us coffee ($5) or help with server cost ($10)

Donate via Paypal

Or Donate anonymously using crypto!

Ethereum

0xfe58350B80634f60Fa6Dc149a72b4DFbc17D341E copy

Bitcoin

3ATGMxNzCUFzxpMCHL5sWSt4DVtS8UqXpi copy

Thank you for your support!

Follow Us!

:(