
Just gonna do a couple #NBERday papers today.
We'll start with one I'm shocked has not absolutely blown up:
Q: Do non-white drivers get pulled over excessively?
A: Maybe.... but maybe not?
#NBERday
nber.org/papers/w28789
We'll start with one I'm shocked has not absolutely blown up:
Q: Do non-white drivers get pulled over excessively?
A: Maybe.... but maybe not?
#NBERday
nber.org/papers/w28789
This paper is responding to a growing literature which uses one key instrument: sunset. Basically, in daylight, cops can see a driver's race. At night, they can't. #NBErday
So if the non-white share of stops falls a lot after sunset, that's proof a lot of daylight stops were racially biased. #NBERday
But this approach has a problem:
What if white and non-white ***driving behaviors*** change around sunset in different ways? Is it possible that minority drivers systematically just *drive faster* specifically at night? #NBERday
What if white and non-white ***driving behaviors*** change around sunset in different ways? Is it possible that minority drivers systematically just *drive faster* specifically at night? #NBERday
This sounds ridiculous at first, however there's a certain logic to it. If minority drivers believe they will be targeted for enforcement, then they might be more conscientious during the day, then ease up at night and drive faster. #NBERday
Sorry, deleted a prior tweet, because I'm realizing I'm not sure I fully understand which direction they're saying the effect runs. Gimme a sec. #NBERday
Okay, I understand it better now.
So they start off looking at traffic fatalities as suggestive evidence that non-white drivers systematically adopt safer driving behaviors in daylight, which would cause the visibility effect to be UNDER-estimated, on average. #NBERday
So they start off looking at traffic fatalities as suggestive evidence that non-white drivers systematically adopt safer driving behaviors in daylight, which would cause the visibility effect to be UNDER-estimated, on average. #NBERday
i.e. it appears that the higher rate of tickets for non-white drivers during daylight hours is despite them having on average *safer* driving behaviors during those hours, suggesting police discrimination may be even MORE widespread #NBERday
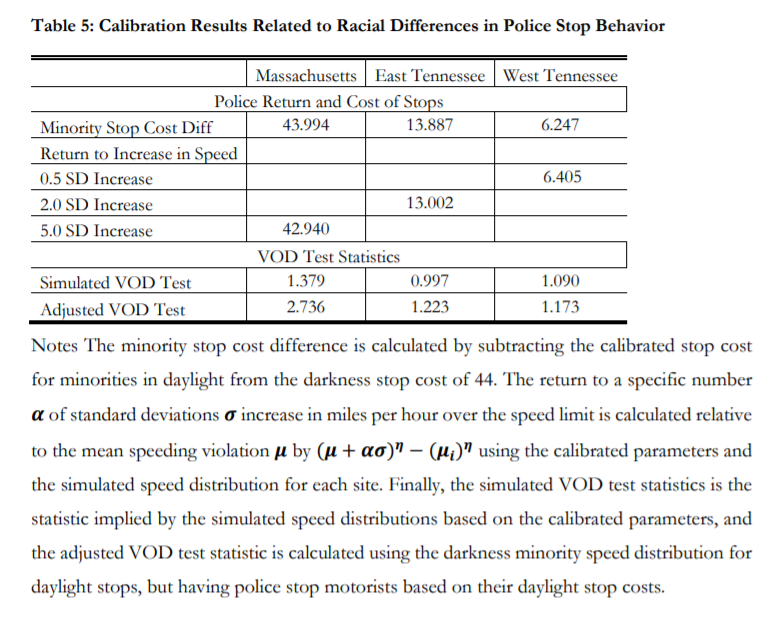
They then test their theory in three places: MA, East TN, and West TN. These datasets of traffic tickets include the exact speed motorists were clocked at, so they make it possible to estimate "stop costs" of speedining. #NBERday
i.e. assuming police are interested in ticketing people who are further over the speed limit, we can then figure out how big that "stop cost" is, i.e. "what effect does being black in the daylight have" #NBERday
Note that the authors seem to have miss-described some of their tables which makes this confusing (i.e. the text seems to sometimes report the inverse of the tables). But basically, this is showing us that MA cops are super racist. #NBERday 
Essentially, this is a way of saying, "For a black driver driving at a given speed, how much more likely does daylight make it that he'll be pulled over?"
In MA, daylight*minority has a HUGE effect. In Tennessee, it's much smaller. #NBERday
In MA, daylight*minority has a HUGE effect. In Tennessee, it's much smaller. #NBERday
This by the way is a nice reminder that "racist southerners, progressive northerners" is probably a not very useful way of thinking about racial politics in the US. #NBERday
The authors like stop costs; but I find this table more intuitive; it shows in East TN the effect is barely significant:
#NBERday
#NBERday
https://twitter.com/desertcran/status/1394340156543492104

Next up:
Q: What is the optimal weight (according to Swiss people)?
A: BMI of 23 for women and 27 for men, according to their own life satisfaction reports.
#NBERday
nber.org/papers/w28791
Q: What is the optimal weight (according to Swiss people)?
A: BMI of 23 for women and 27 for men, according to their own life satisfaction reports.
#NBERday
nber.org/papers/w28791
Basically these authors used a panel of data that had income, BMI, partner status, etc, life satisfaction, and asked, "At what BMI is happiness maximized on average?" That's the 23 and 27 numbers.
#NBERday
#NBERday
But they can also observe income changes in the data, and thus can parameterize the BMI-income tradeoff, i.e. how much income would a person trade off for a different BMI. #NBERday
WHat they find is that men strongly want to avoid being underweight, while women strongly want to avoid being overweight. #NBERday
Moreover, they found that the income-happiness trade-off within married couples was far more sensitive to wife's BMI: men would need a bigger income increase to offset happiness loses from higher/lower income than men would. #NBERday
This was true for own-report and for the spouse; i.e. wives had a lower "price" they'd pay to get their BMI closer to the average-happiness-maximum for females than than their husbands did, and both wives and husbands happiness was more sensitive to the wife's BMI. #NBERday
Now, the wild thing in all this to me is that the optimal BMI for men is 27. That is the BMI at which men tend to be happiest, and on average seems to be about where their wives are happiest? #NBERday
What's also striking is that womens' calculated optimal BMI is largely insensitive to their spouse's BMI, whereas men consistently want to be a couple points higher than their spouse. #NBERday
Now look. It's a fun exercise and all.... but folks I'm super skeptical that we can actually meaningfully parameterize happiness effects of BMI just because we happen to have a survey that also has life satisfaction in it. #NBERday
I think you really want panel variation in BMI for this, and tbh prob some indicators besides BMI. Height may be desirable/undesirable on its own, for example. #NBERday
So anyways. That study suggested that we can provide some consistent linkage between BMI and outcomes like happiness.
But what if we can't?
Q: What's the optimal BMI for longevity?
A: Well, that depends on where you live.
#NBERday
nber.org/papers/w28813
But what if we can't?
Q: What's the optimal BMI for longevity?
A: Well, that depends on where you live.
#NBERday
nber.org/papers/w28813
So here's "minimum mortality curves" for height and weight, i.e. a line showing the height-weight pairing which minimizes age-adjusted death rates, across countries. #NBERday

What's wild is that countries are so different.
In America, for a 1.8 meter man, the optimal weight in terms of minimizing his death odds is 95 kg.
In Mexico, it's 87.
In Norway, it's 80.
In Indonesia, it's 61.
#NBERday
In America, for a 1.8 meter man, the optimal weight in terms of minimizing his death odds is 95 kg.
In Mexico, it's 87.
In Norway, it's 80.
In Indonesia, it's 61.
#NBERday
In other words, in different countries, the health consequences of weight vary widely.
The authors suggest this is because of different technologies and contextual factors. i.e. America can take care of obesity better than Indonesia. #NBERday
The authors suggest this is because of different technologies and contextual factors. i.e. America can take care of obesity better than Indonesia. #NBERday
Maybe that's true. But the key takeaway is bound to get Lifting Bros upset:
In terms of "weight vs. optimal life-expectancy-increasing weight," rich, very overweight countries are in fact NOT more oversight than other countries. #NBERday
In terms of "weight vs. optimal life-expectancy-increasing weight," rich, very overweight countries are in fact NOT more oversight than other countries. #NBERday
In other words, if America got skinnier, we would ***die younger***. That's what the authors seem to be suggesting.
I'm skeptical of that, but they are correct at least about the implications of the crude mortality rates.
#NBERday
I'm skeptical of that, but they are correct at least about the implications of the crude mortality rates.
#NBERday
• • •
Missing some Tweet in this thread? You can try to
force a refresh


