
No one explains EMAs either, so here are my 9/20 EMA rules. I have to give credit to @MullinsMomentum for introducing me to these. I adopted some stuff from him, and the rest I developed my own way of using them. Here's a thread of how I use them:
As a technical/momentum trader, I use the weekly/daily support and resistances, and intraday, I alternate between the 1 minute and 5 minute charts when executing. I typically use the 5 minute for overall trends and the bigger picture, and the 1 minute for my entries and exits
Most of my entries are centered around my support lines, but in an up-trending stock, the 9 ema on the 1 minute can be used as a pull-back entry, so long as the stock isn't overextended. By this, I mean that the stock is riding the 9 ema and not shooting straight up and away
With a pullback entry on the 1 min 9 EMA, I'd use below the 20 EMA as my risk to cut it. Sometimes people will add on that 20 EMA, but this is just what works for me. Now let's look at an example
For reference, the red is my 9 EMA and purple is the 20 EMA. In this picture on the 1-minute chart, you can see $LEDS riding the 1 minute 9 EMA perfectly. The white area shows what I would begin to call the overextended area, where I would sell if I was already in / not add. 

Beyond this, look at the overall picture. It ran bananas and is now overextended, so the bears will go on the offensive now. The stock now does what I mention a lot on voice in the MTA discord: "it needs to breathe". Hence the repeat knives and downtrend
$LEDS It now broke through the 1 min 9 and 20 EMAS (picture). Now I would switch over to the 5 minute to see the overall trend. I do also check the 5 min for overextension. It's more favorable because the 1 minute has too much fluff/noise. Now here's my rules for the 5 minute:

If the stock is trending above the 9 and 20 EMA on the 5 min chart, it's bullish; below is bearish. Also, watch for overextension on both ends.
The 9 on the 5 is a great entry to me. It acts as a support, which as you can see, it bounces off of if buying is still present
$LEDS
The 9 on the 5 is a great entry to me. It acts as a support, which as you can see, it bounces off of if buying is still present
$LEDS
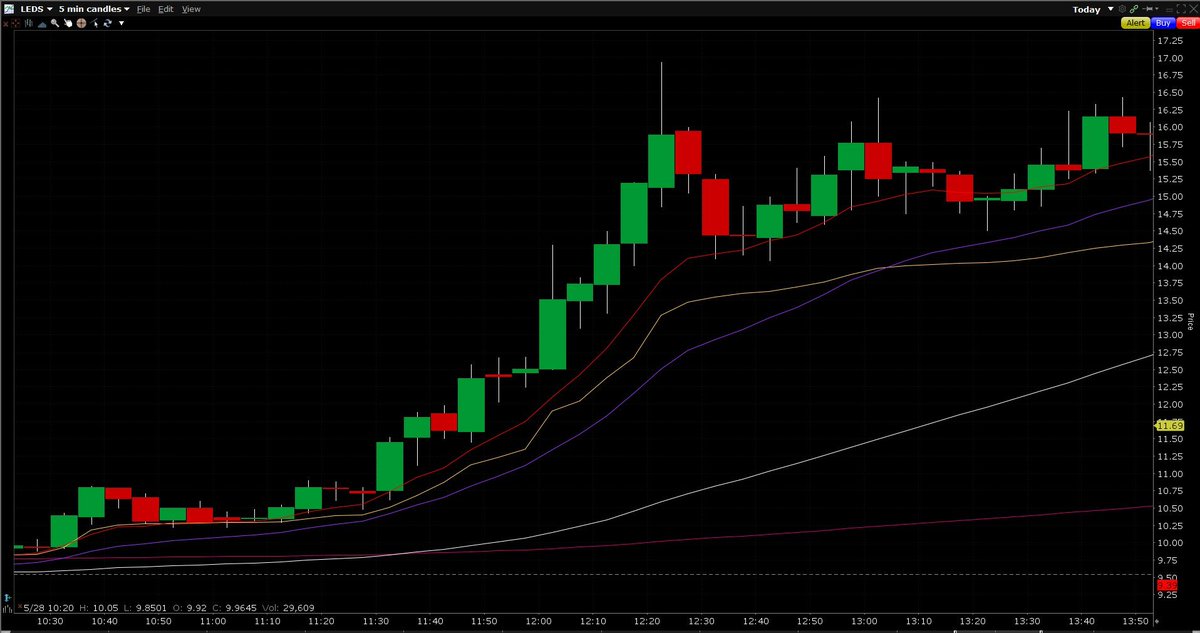
If the stock is below the EMAS, they'll become resistances to break through. Again, overextension (white area) lead to a pullback to the EMA. You can see the 9 EMA (red) acting as resistance along the trend. Once it got between the 9/20, the 9 was support and 20 was resistance

Trying to catch the upside move is tough here because the 9 over the 20 on the 5 minute chart inidcates bullish and the 9 under the 20 (as in the picture above) indicates bearish. As such, it's tough to predict whether they'll crossover again and the stock will be brought to life
Hence, tape reading is vital to understanding whose winning: bulls or bears.
https://twitter.com/LunarAces/status/1398462322390278145?s=20
Some other miscellaneous tips:
If the 5 min closes over the 9 EMA after being stuck between the 9/20 EMA *AND* the next candle begins a push upwards, I slap a long position because it indicates an uptrend to me. The EMA crossover was a plus. Explained this one on voice too
$AMC
If the 5 min closes over the 9 EMA after being stuck between the 9/20 EMA *AND* the next candle begins a push upwards, I slap a long position because it indicates an uptrend to me. The EMA crossover was a plus. Explained this one on voice too
$AMC
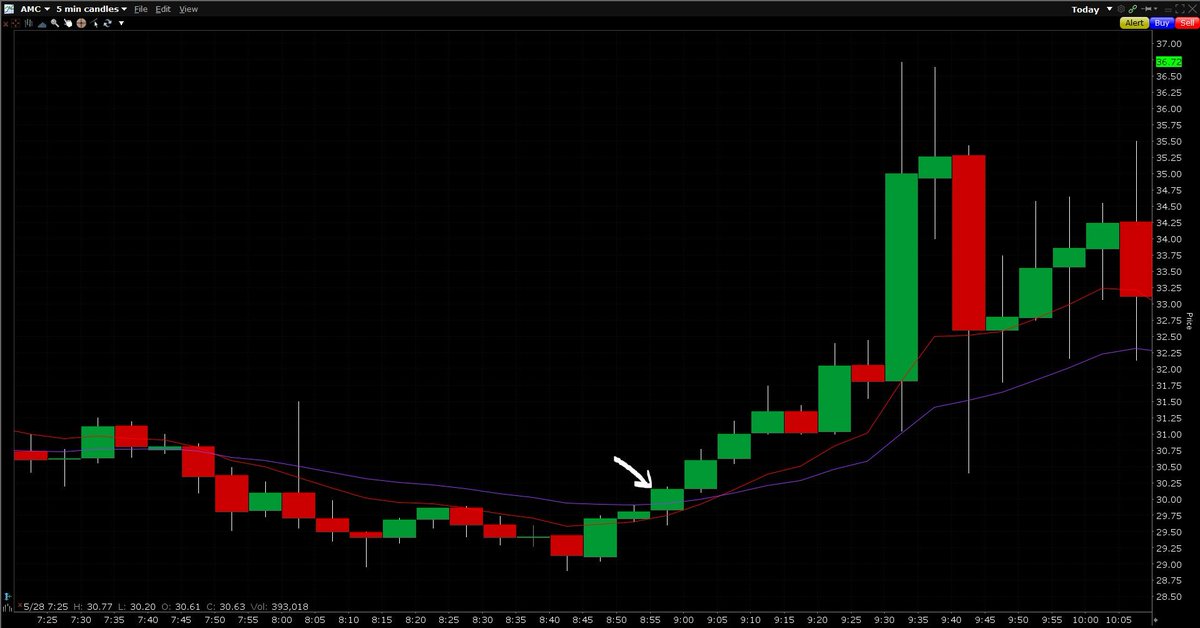
One of the ones I adopted from @MullinsMomentum is the 5 min red candle to the 20 EMA, doji candle on the 20, then a green starts. When you see that green uptrend start, it's a good sign

I'll add more if I recall later, but explaining how to utilize EMAs is very subjective. What works for me may not work for others, and these are just the rules that work for me. You may find others that work better for you.
As such, build your own system and conviction. There is ZERO magic indicators or set of rules that will work EVERY time. That does not exist. Simply put, you are the magic. Learn, adapt and implement. Every trader has a different system. Find yours.
Hope this thread helps! DM me if you have any other questions or hit me up in the MTA discord. Join our live voice sessions everyday while we trade to see how and why we trade the way we do. We just want you guys to learn how to become self-sufficient.
discord.com/invite/MTA
discord.com/invite/MTA
I should add, EMAs are not my bread and butter. My bread and butter is weekly/daily support and resistances. I thrive on those. EMAs are just another tool that I use in my arsenal to complement my trading. EMAs and the Tape for trends and direction, and supports for entries
• • •
Missing some Tweet in this thread? You can try to
force a refresh


