Zack Labe Profile picture
Jun 5, 2021 5 tweets 3 min read Read on X
This is really quite striking... Line graph time series of daily Arctic sea ice extent in 202
Melt ponds are visible on satellite (blue shading) across much of the landfast sea ice along Siberia; e.g., in this image above the Lena River Delta.

[Satellite from 6 June 2021 using Sentinel-2; apps.sentinel-hub.com/sentinel-playg…] Satellite image of landfast ice above the Lena River Delta u
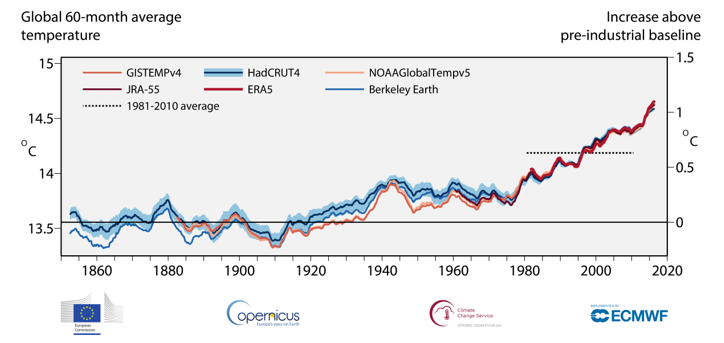
Last month observed temperatures more than 5°C above average across almost the entire Siberian #Arctic... 🔥

[Data from @CopernicusECMWF ERA5] Polar stereographic map of 2-m air temperature anomalies in
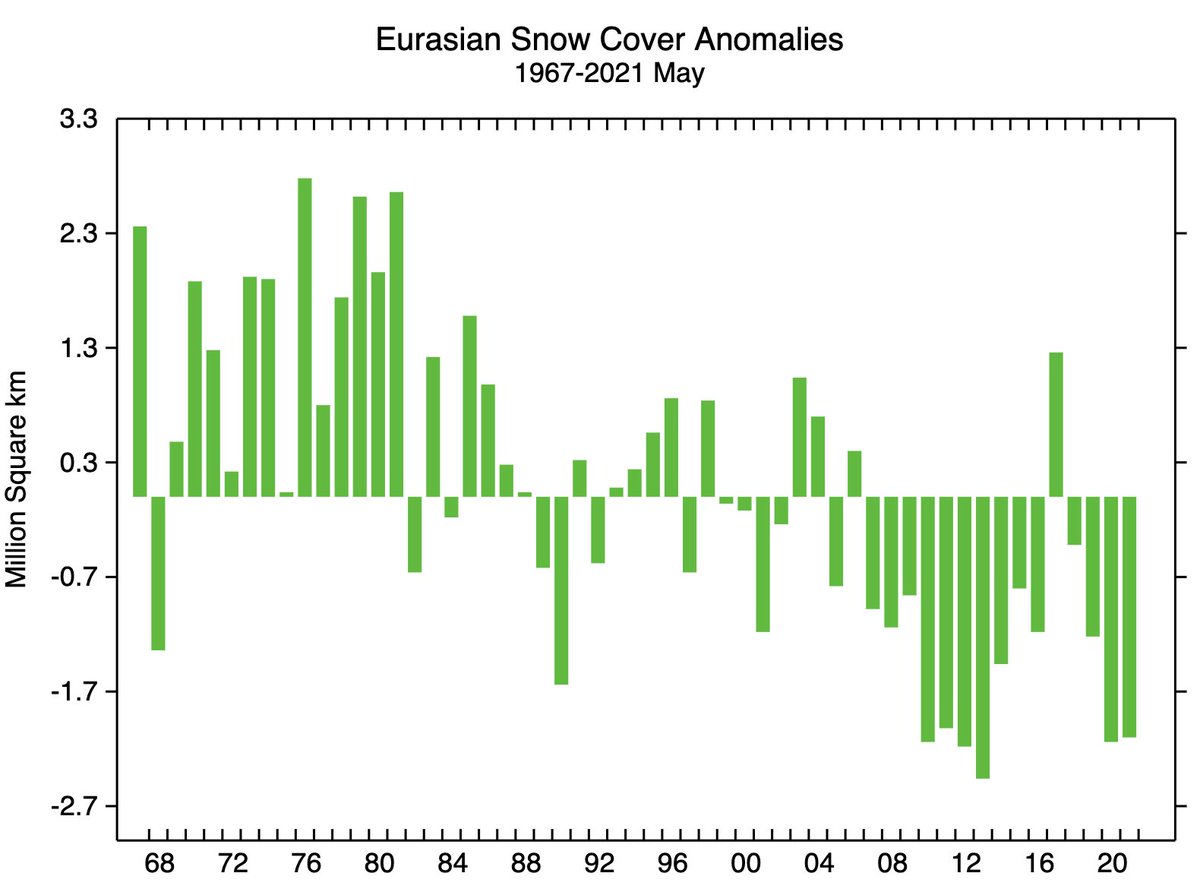
Contributing to the early melt-out is likely a lack of snow cover...

Eurasian snow extent was well below average in May 2021 (top 5 lowest on record).

[Data/graph from climate.rutgers.edu/snowcover/] Bar graph showing Eurasian snow cover anomalies from the 196
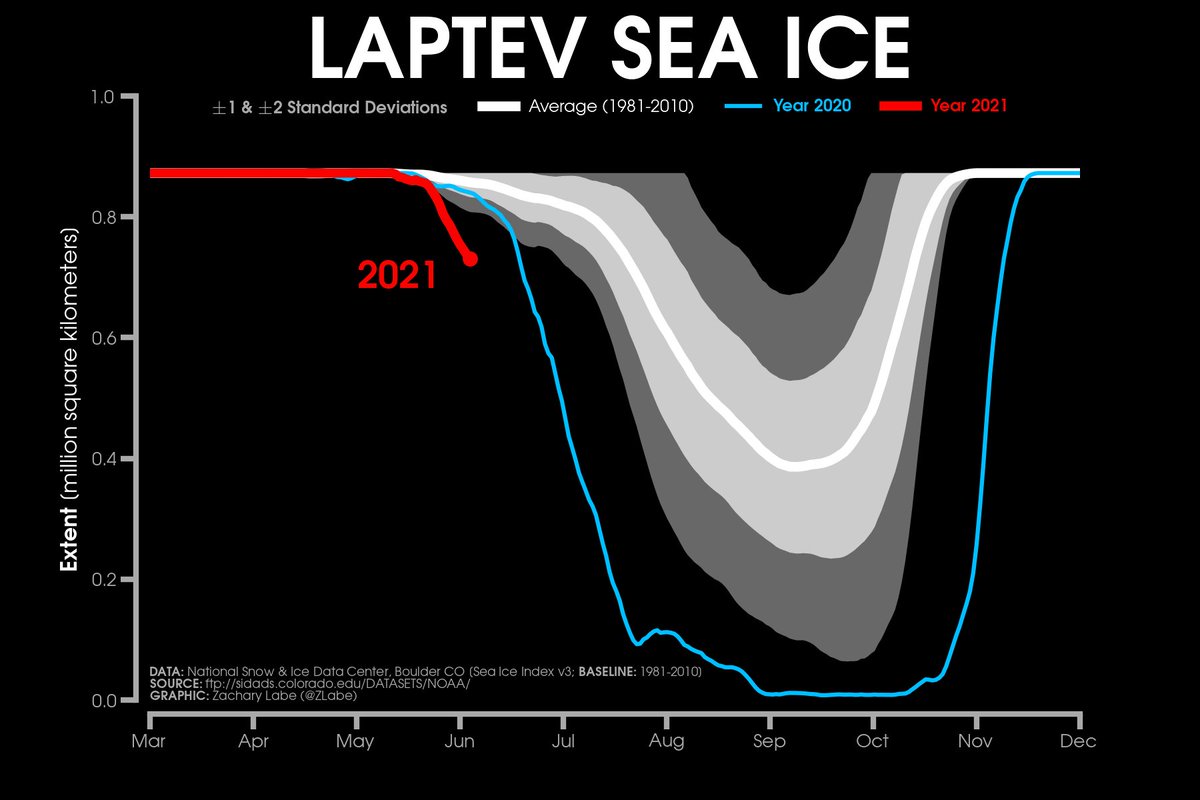
Comparing 2021 to last year's anomalous sea ice extent in the Laptev Sea (located in the Siberian #Arctic)...

[*Note that the basin is geographically constrained (same maximum sea ice cover = flat line in winter)] Line graph time series of 2021's daily Laptev Arctic sea ice

• • •

Missing some Tweet in this thread? You can try to force a refresh
 

Keep Current with Zack Labe

Zack Labe Profile picture

Stay in touch and get notified when new unrolls are available from this author!

Read all threads

This Thread may be Removed Anytime!

PDF

Twitter may remove this content at anytime! Save it as PDF for later use!

Try unrolling a thread yourself!

how to unroll video
  1. Follow @ThreadReaderApp to mention us!

  2. From a Twitter thread mention us with a keyword "unroll"
@threadreaderapp unroll

Practice here first or read more on our help page!

More from @ZLabe

Sep 18, 2022
Looking for polar climate visualizations? Start here: 📈📉

+ Arctic sea-ice extent: zacklabe.com/arctic-sea-ice…
+ Arctic sea-ice thickness/volume: zacklabe.com/arctic-sea-ice…
+ Arctic temperatures: zacklabe.com/arctic-tempera…
+ Antarctic sea ice: zacklabe.com/antarctic-sea-…
You can also find...
+ Global sea ice: zacklabe.com/global-sea-ice…
+ Archives of Arctic climate rankings (2012-2022): zacklabe.com/archive-2022/

+ Long-term climate change: zacklabe.com/arctic-sea-ice…
+ Arctic climate model projections compared to observations: zacklabe.com/climate-model-…
To improve transparency of climate data and processing methods, check out my...

+ References for the raw climate data (all free): zacklabe.com/resources-and-…

+ #Python, visualization tools, and other software (all open source and free): zacklabe.com/methods-and-op…
Read 19 tweets
Jan 27, 2022
🧵 While extreme events receive a lot of the attention in the #Arctic, it's more the long-term trends that are transforming this part of the world. Interannual variability (e.g., weather) is also large, which is why not every year is a new record. Here are those January trends:
Nearly all areas of the #Arctic have observed thinning ice over the last four decades. Trends in January are largest in the vicinity of the East Siberian Sea and north of Greenland.

[Data simulated from PIOMAS. For more info: doi.org/10.1175/JCLI-D…] Polar stereographic map of Arctic sea ice thickness trends f
In contrast, sea ice concentration trends in January are only confined to the outer edges of the #Arctic Ocean, such as the Barents-Kara Seas and Sea of Okhotsk.

[Sea ice concentration = fraction of ice-cover. For more info: doi.org/10.1175/BAMS-D…] Polar stereographic map showing Arctic sea ice concentration
Read 6 tweets
Dec 14, 2021
The annual @NOAA Arctic Report Card is available today for 2021. It discusses recent changes in the #Arctic, extreme events, and broader human/environmental impacts.

+ Report: arctic.noaa.gov/Report-Card/Re…
+ Video:
+ Highlights: arctic.noaa.gov/Report-Card Infographic showing a visual of the highlights in the 2021 A
@NOAA @NOAAResearch @NOAANCEI I am happy again to have played a small role in this year's report - see our section on Arctic sea surface temperatures: arctic.noaa.gov/Report-Card/Re…

Also check out the fantastic collection of visuals by @NOAAClimate at climate.gov/news-features/… Map and line graph showing Arctic warming since the mid 1960
@NOAA @NOAAResearch @NOAANCEI @NOAAClimate @CSUAtmosSci "The Arctic story is a human story, and we all have a role to play in creating the best possible outcomes for the region, its residents, and all the citizens of the globe who depend on the Arctic as a critical component of our Earth system." ---> arctic.noaa.gov/Report-Card/Re…
Read 6 tweets
May 30, 2021
More reading! A thread of peer-reviewed studies evaluating projections of 21st century Arctic sea-ice extent/area/thickness (seasonally ‘ice-free’)... 🧊📉

I am sure I missed a few, so feel free to add.

Note – I am not making any predictions from this thread 😅 Visualization showing monthly Arctic sea ice conditions at d
+ (02 – HadCM3 area/volume) doi.org/10.1029/2001GL…
+ (04 – ECHAM4/HadCM3 extent) doi.org/10.3402/tellus…
+ (05 – perspective) doi.org/10.1029/2005EO…
+ (06 – CMIP3 area) doi.org/10.1175/JCLI37…
+ (06 – CCSM3 extent) doi.org/10.1029/2006GL…
+ (07 – CMIP3 regional extent) doi.org/10.1029/2007GL…
+ (07 – CMIP3 extent) doi.org/10.1029/2007GL…
+ (09 – Constraining CMIP3 extent) doi.org/10.1029/2009GL…
+ (09 – Reducing spread CMIP3 extent) nature.com/articles/ngeo4…
+ (11 – CCSM4 extent) doi.org/10.1029/2011GL…
Read 9 tweets
Mar 27, 2021
Over the last 5 years, there have been plenty of extreme weather/climate events in the #Arctic. While the scientific process takes time, there are now lots of studies investigating these cases. Please add to this thread with other peer-reviewed studies on recent Arctic extremes!
*Overall trends/extremes/reviews*

+ Warming warming events: agupubs.onlinelibrary.wiley.com/doi/full/10.10…
+ Poleward moisture transport: onlinelibrary.wiley.com/doi/abs/10.100…
+ Arctic cyclones: doi.org/10.1017/aog.20…
+ Arctic sea ice: iopscience.iop.org/article/10.108…
+ “New Arctic”: nature.com/articles/s4155…
+ 2015 Alaskan wildfires: journals.ametsoc.org/view/journals/…
+ 2015 Greenland melt: nature.com/articles/ncomm…
+ Winter 2015 cyclones: nature.com/articles/s4159…
+ Arctic 2015 extremes: agupubs.onlinelibrary.wiley.com/doi/full/10.10…
+ December 2015 warm air event: agupubs.onlinelibrary.wiley.com/doi/10.1002/20…
Read 9 tweets
Jan 8, 2020
🚨 2019 was the 2nd warmest year on record - @CopernicusECMWF analysis. An excellent summary is provided at climate.copernicus.eu/copernicus-201…

While 2019 rankings between various data sets may differ slightly (e.g., 2 or 3), the long-term warming is undoubtedly clear... Line graph time series of running mean global temperatures for various data sets
🚨 Last year's #Arctic sea ice extent averaged the *2nd lowest* on record. Sea ice is declining in all months of the year (iopscience.iop.org/article/10.108…).

Check out @NSIDC's annual/decade summary: nsidc.org/arcticseaicene…
🚨 #Arctic sea ice volume in 2019 also averaged the *2nd lowest* on record (albeit close to the last few years).

Check out @PolarScience_UW's summary: psc.apl.uw.edu/research/proje… Line graph time series of annual mean Arctic sea ice volume from 1979 to 2019
Read 5 tweets

Did Thread Reader help you today?

Support us! We are indie developers!


This site is made by just two indie developers on a laptop doing marketing, support and development! Read more about the story.

Become a Premium Member ($3/month or $30/year) and get exclusive features!

Become Premium

Don't want to be a Premium member but still want to support us?

Make a small donation by buying us coffee ($5) or help with server cost ($10)

Donate via Paypal

Or Donate anonymously using crypto!

Ethereum

0xfe58350B80634f60Fa6Dc149a72b4DFbc17D341E copy

Bitcoin

3ATGMxNzCUFzxpMCHL5sWSt4DVtS8UqXpi copy

Thank you for your support!

Follow Us!

:(