Zack Labe Profile picture
Climate Scientist (Atmospheric) PhD | Postdoc at @Princeton and @NOAA_GFDL | Sharing data-driven stories | He/Him | Views my own
RadReduction (Larry Edwards) Profile picture 1 subscribed
Sep 18, 2022 19 tweets 12 min read
Looking for polar climate visualizations? Start here: 📈📉

+ Arctic sea-ice extent: zacklabe.com/arctic-sea-ice…
+ Arctic sea-ice thickness/volume: zacklabe.com/arctic-sea-ice…
+ Arctic temperatures: zacklabe.com/arctic-tempera…
+ Antarctic sea ice: zacklabe.com/antarctic-sea-… You can also find...
+ Global sea ice: zacklabe.com/global-sea-ice…
+ Archives of Arctic climate rankings (2012-2022): zacklabe.com/archive-2022/

+ Long-term climate change: zacklabe.com/arctic-sea-ice…
+ Arctic climate model projections compared to observations: zacklabe.com/climate-model-…
Jan 27, 2022 6 tweets 5 min read
🧵 While extreme events receive a lot of the attention in the #Arctic, it's more the long-term trends that are transforming this part of the world. Interannual variability (e.g., weather) is also large, which is why not every year is a new record. Here are those January trends: Nearly all areas of the #Arctic have observed thinning ice over the last four decades. Trends in January are largest in the vicinity of the East Siberian Sea and north of Greenland.

[Data simulated from PIOMAS. For more info: doi.org/10.1175/JCLI-D…] Polar stereographic map of Arctic sea ice thickness trends f
Dec 14, 2021 6 tweets 7 min read
The annual @NOAA Arctic Report Card is available today for 2021. It discusses recent changes in the #Arctic, extreme events, and broader human/environmental impacts.

+ Report: arctic.noaa.gov/Report-Card/Re…
+ Video:
+ Highlights: arctic.noaa.gov/Report-Card Infographic showing a visual of the highlights in the 2021 A @NOAA @NOAAResearch @NOAANCEI I am happy again to have played a small role in this year's report - see our section on Arctic sea surface temperatures: arctic.noaa.gov/Report-Card/Re…

Also check out the fantastic collection of visuals by @NOAAClimate at climate.gov/news-features/… Map and line graph showing Arctic warming since the mid 1960
Jun 5, 2021 5 tweets 3 min read
This is really quite striking... Line graph time series of daily Arctic sea ice extent in 202 Melt ponds are visible on satellite (blue shading) across much of the landfast sea ice along Siberia; e.g., in this image above the Lena River Delta.

[Satellite from 6 June 2021 using Sentinel-2; apps.sentinel-hub.com/sentinel-playg…] Satellite image of landfast ice above the Lena River Delta u
May 30, 2021 9 tweets 9 min read
More reading! A thread of peer-reviewed studies evaluating projections of 21st century Arctic sea-ice extent/area/thickness (seasonally ‘ice-free’)... 🧊📉

I am sure I missed a few, so feel free to add.

Note – I am not making any predictions from this thread 😅 Visualization showing monthly Arctic sea ice conditions at d + (02 – HadCM3 area/volume) doi.org/10.1029/2001GL…
+ (04 – ECHAM4/HadCM3 extent) doi.org/10.3402/tellus…
+ (05 – perspective) doi.org/10.1029/2005EO…
+ (06 – CMIP3 area) doi.org/10.1175/JCLI37…
+ (06 – CCSM3 extent) doi.org/10.1029/2006GL…
Mar 27, 2021 9 tweets 10 min read
Over the last 5 years, there have been plenty of extreme weather/climate events in the #Arctic. While the scientific process takes time, there are now lots of studies investigating these cases. Please add to this thread with other peer-reviewed studies on recent Arctic extremes! *Overall trends/extremes/reviews*

+ Warming warming events: agupubs.onlinelibrary.wiley.com/doi/full/10.10…
+ Poleward moisture transport: onlinelibrary.wiley.com/doi/abs/10.100…
+ Arctic cyclones: doi.org/10.1017/aog.20…
+ Arctic sea ice: iopscience.iop.org/article/10.108…
+ “New Arctic”: nature.com/articles/s4155…
Jan 8, 2020 5 tweets 5 min read
🚨 2019 was the 2nd warmest year on record - @CopernicusECMWF analysis. An excellent summary is provided at climate.copernicus.eu/copernicus-201…

While 2019 rankings between various data sets may differ slightly (e.g., 2 or 3), the long-term warming is undoubtedly clear... Line graph time series of running mean global temperatures for various data sets 
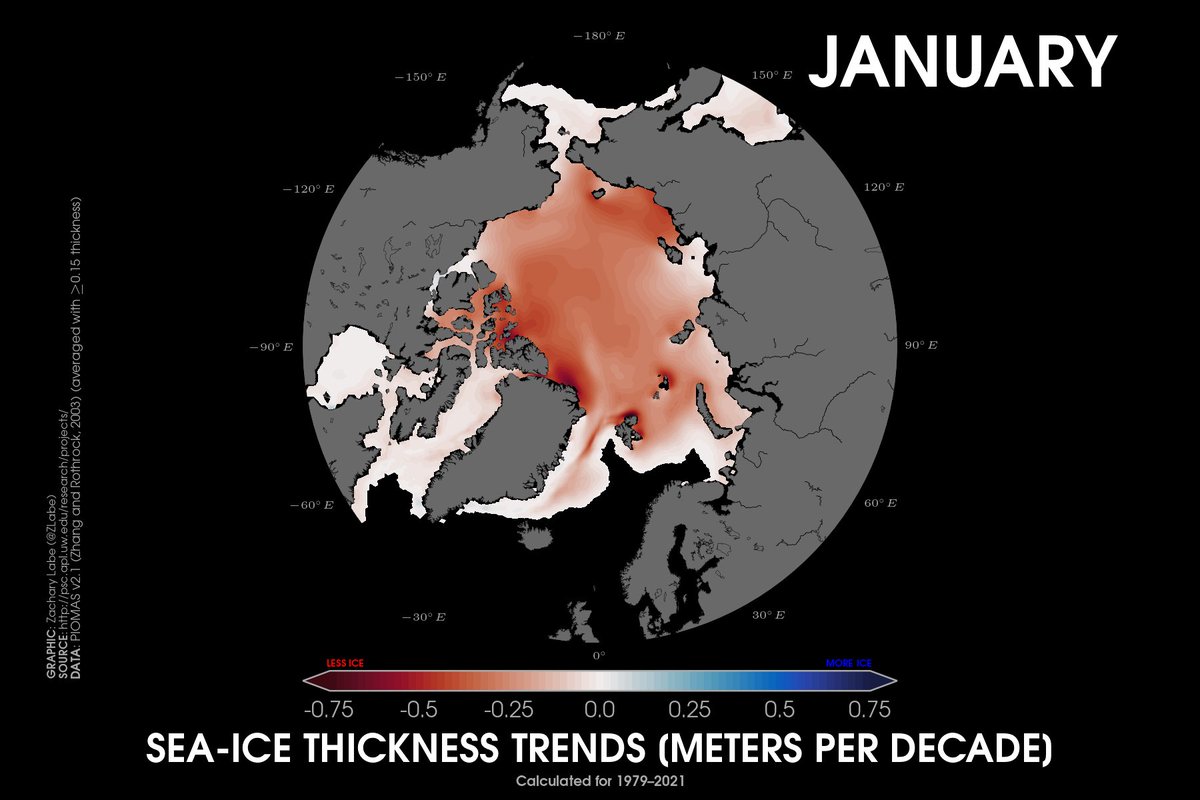
🚨 Last year's #Arctic sea ice extent averaged the *2nd lowest* on record. Sea ice is declining in all months of the year (iopscience.iop.org/article/10.108…).

Check out @NSIDC's annual/decade summary: nsidc.org/arcticseaicene…