Model update klaxon!! I’ve spent a while this weekend refitting my model to current data and trends, and as a result I’ve changed my mind on at least 3 things – and also got closer to a policy recommendation for Step 4 re-opening scheduled for 21st June. Thread follows: 1/n
First to note a few assumptions:
-Baseline controls and cautious behaviour (e.g. continued WFH) are assumed to continue after 21st June, until the end of 2021, and to reduce R by ~25%
-I’ve adjusted my vaccination schedules to more precisely match current supply estimates 2/n
-Baseline controls and cautious behaviour (e.g. continued WFH) are assumed to continue after 21st June, until the end of 2021, and to reduce R by ~25%
-I’ve adjusted my vaccination schedules to more precisely match current supply estimates 2/n
– with thanks as always to @PaulMainwood for his insights on this.
-In particular, now that we have MHRA approval for 12-15 year olds to receive Pfizer, I’ve assumed that 12-17s get their first doses in September (& second doses in November) 3/n
-In particular, now that we have MHRA approval for 12-15 year olds to receive Pfizer, I’ve assumed that 12-17s get their first doses in September (& second doses in November) 3/n
-NB I haven’t modelled booster vaccinations for over-50s, nor any waning of immunity over time
-I’ve assumed the Delta variant has an effect of doubling the ratio of hospitalisations to infections in all age groups (as per PHE data, which also helps my model to match the 4/n
-I’ve assumed the Delta variant has an effect of doubling the ratio of hospitalisations to infections in all age groups (as per PHE data, which also helps my model to match the 4/n
...current data – it was previously diverging by under-predicting hospital admissions)
-I have not changed my IFR estimates; so please note that if those extra hospitalisations feed through into extra deaths, my death figures could be understated by a factor of 2 or more. 5/n
-I have not changed my IFR estimates; so please note that if those extra hospitalisations feed through into extra deaths, my death figures could be understated by a factor of 2 or more. 5/n
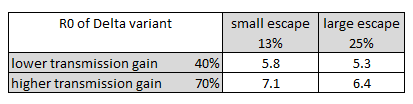
-Since there remains some uncertainty as to exactly how transmissible Delta is (relative to Alpha), and how much of the apparent transmission gain is the effect of immunity escape, I’ve taken a scenario approach to this, with 4 main scenarios: 6/n
-Two scenarios have a significant immunity escape, which causes a 25% transmission gain, and the other two have a smaller escape, which causes only 12% gain
-On the other axis is the total transmission gain, which is 40% in two of the scenarios, and 70% in the other two. 7/n
-On the other axis is the total transmission gain, which is 40% in two of the scenarios, and 70% in the other two. 7/n
The table below shows the R0 of the Delta variant which is assumed in each of these 4 scenarios – as you can see, it ranges from a bit above 5, to just over 7 – still quite a wide range of uncertainty: 8/n 
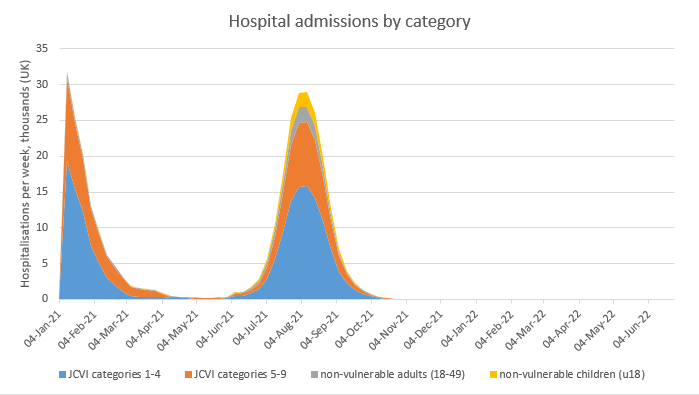
In the two scenarios with lower (40%) total transmission gain, we have a moderately-sized exit wave, with peak hospitalisations of around 5000 per week, and total deaths of 5-10k (although note if my IFR estimates for Delta are wrong, that could be too low): 9/n
In the two scenarios with higher (70%) total transmission gain, we have a much larger exit wave, with peak hospitalisations of 20-30k per week (close to Jan 2021 levels), and total deaths in the 12-16k range – again note this could be under-estimated. 10/n
The first thing I’ve (partially) changed my mind on is the short-term dynamics. I was previously confident that R would fall away over the next 1-2 weeks, to around 1.1-1.2, before 21st June. That could still happen, if we’re in the 40% transmission scenarios, but... 11/n
…in the 70% transmission gain scenarios, R is more likely to stay in the 1.3-1.4 range over the next couple of weeks, as we still have some ‘damage’ from Delta to feed in (as it spreads into other regions), which will offset the benefits of vaccinations and warmer weather. 12/n
Unfortunately, distortions caused by half term and bank holidays to testing and infection patterns may confuse the picture over the next fortnight, making it harder to tell which of these scenarios is actually happening in real life. 13/n
The second thing I’ve changed my mind on is the impact of different lengths of delay to the Step 4 re-opening, scheduled for 21st June. I was previously arguing that a short (2-3 week) delay was unlikely to achieve much, except possibly to gain time to gather more data. 14/n
And that a longer delay (of 2-3 months, to late August or early September) would be more effective, as it would enable us to get more people double-vaxxed, before letting Delta run free. With more careful modelling, I now have reason to amend both of those views. 15/n
To illustrate this, I have taken the most severe of my 4 scenarios, with the higher (70%) transmission gain and the larger immunity escape, and plotted both the total deaths and peak hospitalisations for different dates of re-opening (Step 4): 16/n

This shows that, while short delays to re-opening don’t save many lives, they do have a big impact on predicted peak hospitalisations, bringing them down out of the “danger zone” to NHS capacity– effectively, the exit wave is being flattened out or split into smaller waves: 17/n

We can also note that delaying re-opening until September could make things worse, as it pushes the resulting exit wave into the winter. However I note that this situation could be improved by using booster vaccinations, or retaining baseline controls for longer into 2022. 18/n

The story is similar for my other high-transmission scenario (the one with the smaller vaccine escape) – except that here, the optimal point for re-opening looks to be a bit earlier e.g. in late July or early August, rather than in mid-August. 19/n

So, what’s my conclusion on Step 4? Well, I still want to gather more data before giving a final view. But if Matt Hancock’s reference today to a 40% transmission gain stands up (and assuming he was referring to the total gain, including the impact of immunity escape), 20/n
… then it may be that we could go ahead as planned on or close to 21st June. If however, the gain of 70% that we see in the genomics and case data (from @TWenseleers and @alexselby1770 analysis) persists, then we are facing a much larger exit wave, close to NHS capacity. 21/n
In those circumstances, I don’t think I could recommend proceeding with Step 4 as planned, if another NHS-threatening wave was on the horizon. And from the analysis shown above, I would (tentatively, at this stage) suggest a 5-6 week delay to late July/early August. 22/n
So, how can we work out which of those situations applies? Two main ways: firstly, new data to be published by PHE in the next Technical Briefing on vaccine effectiveness vs. Delta, on re-infection rates, and on Secondary Attack Rates. And secondly, the daily dashboard... 23/n
…data on cases and hospitalisations may enable us to refine our view of R, and hence the transmission gain we are seeing in practice. (although as noted above, distortions caused by half term and bank holidays may cloud this picture somewhat). 24/n
I’m hopeful that the combination of those two data sources may enable us to get to a clearer view before decisions need to be made on the 14th June. If not, there may still be a case for a short (e.g. 2 week) delay to enable the data to settle down a bit. 25/n
I would stress that there is still a wide funnel of uncertainty, and my model doesn’t capture all of the dynamics that may be important. For example, stronger seasonality than I’ve allowed for, or heterogeneity effects in immunity acquisition, could make things better. 26/n
But on the other hand, waning of immunity over time, and differences in immunity and natural R between different regions and age groups, could cause things to evolve in less favourable directions. The SPI-M models will capture some of these dynamics better than mine does. 27/n
You may recall I’d said I’d changed my mind on 3 things, and I’ve so far only mentioned 2. So what’s the third? Vaccination of teenagers. I was previously promoting this as a helpful step towards the herd-immunity threshold, and was keen to get it done ASAP e.g. in July. 28/n
But looking at the models now, it doesn’t make much difference. Why is this? Partly because of Delta’s escape on the 1st dose, which makes it less effective, and also because the exit wave is now starting earlier (in June), so vaccinating in July is already too late. 29/n
Hence the impact is marginal, and so it’s hard to justify doing it (vs. sending the vaccine to help older people in other countries). There may still be arguments for vaccinating UK teenagers at a later stage, but right now this analysis suggests it shouldn’t be a priority. 30/n
I think that’s enough changes of mind for one day, so will leave it there for now – I’ll update again if & when we get more data from PHE. And apologies I won't be around much to answer questions today - I need to get back to work! /end.
• • •
Missing some Tweet in this thread? You can try to
force a refresh