@VitalityBlast: Batting Data Analysis since 2019:A Thread
The aim of this thread here is to find where different teams need to focus - Scoring Boundaries or strike rotation in different phases of the match and the importance of boundaries in #vitalityblast.
RTSs are appreciated.
The aim of this thread here is to find where different teams need to focus - Scoring Boundaries or strike rotation in different phases of the match and the importance of boundaries in #vitalityblast.
RTSs are appreciated.

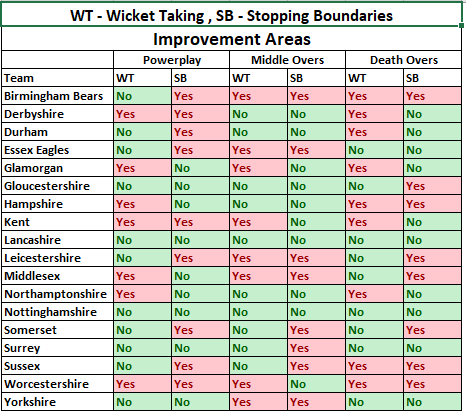
@hantscricket, @lancscricket,@KentCricket, @DerbyshireCCC are in need of boundary hitters for all phases. The above table shows the detailed analysis of improvement areas needed for all teams.
Please follow the thread to know the detailed analysis and let me know your feedback
Please follow the thread to know the detailed analysis and let me know your feedback
%Boundary Runs - %of Runs scored in boundaries
Non-Boundary Strike Rate - Strike Rate of teams without considering boundary runs and balls. It also helps to know if the team plays a lot of dot balls or not.
Non-Boundary strike rate inspiration- @SAAdvantage
Data:@cricsheet
Non-Boundary Strike Rate - Strike Rate of teams without considering boundary runs and balls. It also helps to know if the team plays a lot of dot balls or not.
Non-Boundary strike rate inspiration- @SAAdvantage
Data:@cricsheet
An ideal place for teams is to be on the top right corner in the above graphs which means they have an above-average boundary scoring% above average very strike rotation.
@Gloscricket @EssexCricket @surreycricket @YorkshireCCC and @SomersetCCC all belong to the top right corner.
@Gloscricket @EssexCricket @surreycricket @YorkshireCCC and @SomersetCCC all belong to the top right corner.

While teams like @TrentBridge, @SussexCCC, and @WorcsCCC have very good % Boundary runs but a little less than average strike rotation. It is important to note that these teams might have less non-boundary strike rate but still had very good vitality blasts season.
While teams like @TrentBridge, @SussexCCC, and @WorcsCCC have very good % Boundary runs but a little less than average strike rotation. It is important to note that these teams might have less non-boundary strike rate but still had very good vitality blasts season.
We look at which teams have a better run rate, one with the bests % boundary runs and lesser Non-Boundary strike rate or one which is above average % Boundary runs and Non-Boundary Strike rate.
Somerset and Yorkshire have the best run rate in vitality blast.
Somerset and Yorkshire have the best run rate in vitality blast.

Although it is important to see in the above graph that teams like @TrentBridge,@SussexCCC, and @WorcsCCC who had less than average non-boundary strike rate but among the bests in % boundary runs score almost equal to teams like @surreycricket, @Gloscricket, and @EssexCricket
who has lesser %boundary runs than them but a better non-boundary strike rate. This shows that scoring more boundaries can make up for the dot balls played to an extent unless it has a very poor non-boundary strike rate like @NorthantsCCC.
Teams like @KentCricket and @DurhamCricket who are very good in strike rotation but not so good in boundary hitting have less than average run rates in the vitality blast. This one again shows how boundary hitting has more impact than strike rotation in T20 cricket.

We now move forward to team boundary hitting ability and strike rotation in different phases of the game. This will allow us to know if there are certain phases of the game where the teams should improve which has resulted in their less run rate in #vitalityblast
Powerplay:
Interesting addition here is @DurhamCricket who were not so good in Boundary runs% in the overall graph do pretty well in the powerplay. Also, @SomersetCCC who are 2nd best overall in boundary runs% overall go below tournament average in the powerplay.
Interesting addition here is @DurhamCricket who were not so good in Boundary runs% in the overall graph do pretty well in the powerplay. Also, @SomersetCCC who are 2nd best overall in boundary runs% overall go below tournament average in the powerplay.

@GlamCricket @hantscricket @DerbyshireCCC and @WarwickshireCCC all 4 have a very low run rate in the powerplay who also are among the teams with very poor % boundary runs.

Middle Overs:
@SomersetCCC do brilliantly in the middle overs while teams like @NorthantsCCC and @GlamCricket do poorly in the middle overs. Surprising inclusion is @Middlesex_CCC who are above average in both areas in the middle overs.
@SomersetCCC do brilliantly in the middle overs while teams like @NorthantsCCC and @GlamCricket do poorly in the middle overs. Surprising inclusion is @Middlesex_CCC who are above average in both areas in the middle overs.

Further teams like @TrentBridge and @WorcsCCC who have less than average Non-Boundary Strike rate are among the top 3 teams having the best run rate in the middle overs. While @NorthantsCCC and @GlamCricket have the least run rates in the middle overs.

Death Overs:
For the first time, someone has a better %Boundary Runs then @TrentBridge and its @SomersetCCC, While when the focus is to hit boundaries @DurhamCricket and @leicsccc have struggled to hit boundaries even though they have excellent non-boundary strike rate.
For the first time, someone has a better %Boundary Runs then @TrentBridge and its @SomersetCCC, While when the focus is to hit boundaries @DurhamCricket and @leicsccc have struggled to hit boundaries even though they have excellent non-boundary strike rate.

No surprise that @SomersetCCC has the best run-rate and @DurhamCricket and @leicsccc the worst run rate in death overs looking at their Boundary runs%. Surprise here is the run rate of the defending champions @TrentBridge in the death who just has average run rate in death overs

Further Scope: To compare innings and compare the average run rate of the teams in the match where they have been involved and compare with the team run rate.Example. The average run rate of Bears is 8.5 in Powerplay but the average run rate in the PP in matches they played is 10
@deburchery @malolanr @aknightwatchman @srini_vk @Vitu_E @allaboutsriram @andymcg_cricket @analysis_si @SkyCricket @CricFit @Santokie89 @TheCricketGirll @thecricketmen @TheCricketPanda @himanshux_ @CricRicky @guerillacricket
Please let me know your feedback. Thanks :)
Please let me know your feedback. Thanks :)
Updated Table with @leicsccc included. Extremely sorry for missing them out in the first place.
Improvement areas:
Boundary hitting in middle overs and death overs.
Strike Rotation in Powerplay
Improvement areas:
Boundary hitting in middle overs and death overs.
Strike Rotation in Powerplay

@threadreaderapp unroll please
• • •
Missing some Tweet in this thread? You can try to
force a refresh