@VitalityBlast: Bowling Data Analysis since 2019:A Thread.
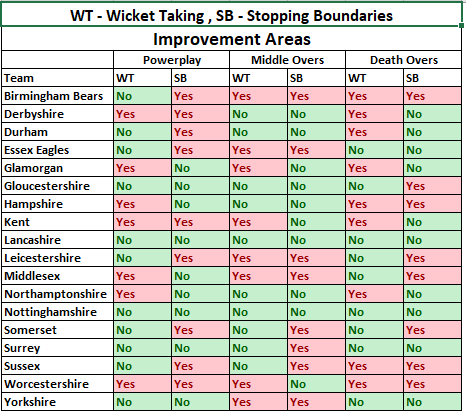
The aim of this thread here is to find where different teams need to focus - Taking more wickets or stopping boundaries in different phases of the match in #vitalityblast.
RTSs and feedback are appreciated.
#Cricket
The aim of this thread here is to find where different teams need to focus - Taking more wickets or stopping boundaries in different phases of the match in #vitalityblast.
RTSs and feedback are appreciated.
#Cricket

The above table shows the detailed analysis of improvement areas needed for all teams. Teams like @KentCricket and @WorcsCCC need wicket-takers, while teams like @WarwickshireCCC, @leicsccc, and @SussexCCC need to focus on stopping boundaries in all phases of the match.
This table shows how the teams are ranked in terms of wicket-taking and stopping boundaries in different phases of the match. Ranking criteria
Wicket Taking - Number of Balls taken to take a wicket(BPW).
Stopping Boundaries - Less Boundary Runs%.
Wicket Taking - Number of Balls taken to take a wicket(BPW).
Stopping Boundaries - Less Boundary Runs%.

BPW- Number of Balls taken to take a wicket
% Boundary runs-%of Runs conceded in boundaries
An ideal place for teams is to be on the bottom left corner in the below graphs which means they have a better wicket-taking ability and also concedes less % of total runs in boundaries.
% Boundary runs-%of Runs conceded in boundaries
An ideal place for teams is to be on the bottom left corner in the below graphs which means they have a better wicket-taking ability and also concedes less % of total runs in boundaries.
@TrentBridge @lancscricket @Gloscricket @DurhamCricket @surreycricket are the 5 teams that are very good in both aspects - taking wickets and stopping boundaries, while @GlamCricket @hantscricket and @NorthantsCCC need to improve on wicket-taking. 

@SomersetCCC,@Middlesex_CCC,@YorkshireCCC,@SussexCCC, and @EssexCricket all have a very good wicket-taking ratio but need to improve on stopping boundaries. We will in the below graph look if taking wickets is enough to restrict teams or teams also need to stop boundaries.
Now if you look at the below graph you will notice that the teams talked about in the above tweet have conceded more than average despite having a good wicket-taking ratio. The reason is the lack of boundary stopping.
#England
#England

Teams like @NorthantsCCC and @hantscricket have poor wicket-taking ratios and still have conceded less than average due to an excellent boundary-stopping ability. As a result, it is important for teams to focus on stopping boundaries along with taking wickets.
#Cricket
#Cricket
Powerplay:
@TrentBridge has the best bowling performance in the powerplay while @WorcsCCC is exactly on the opposite end. Teams like @leicsccc and @WarwickshireCCC have been able to take wickets but couldn't stop teams from scoring big.
@TrentBridge has the best bowling performance in the powerplay while @WorcsCCC is exactly on the opposite end. Teams like @leicsccc and @WarwickshireCCC have been able to take wickets but couldn't stop teams from scoring big.

@DurhamCricket @SussexCCC and @lancscricket all do very well in the powerplay. While @KentCricket @Middlesex_CCC @GlamCricket and @DerbyshireCCC need to improve in the powerplay. 

Middle Overs:
It is interesting to see how @hantscricket and @NorthantsCCC who were not able to take wickets in powerplay have a very good wicket-taking record in middle overs.
It is interesting to see how @hantscricket and @NorthantsCCC who were not able to take wickets in powerplay have a very good wicket-taking record in middle overs.

The reason could be since they concede less in powerplay the pressure to score faster in middle overs on the opposition might be resulting in wickets. Teams like @Middlesex_CCC and @EssexCricket who had a good wicket-taking ratio in Powerplay do not perform well in middle overs. 

Death Overs:
@DurhamCricket concedes the least % of its runs in boundaries while @SomersetCCC concedes most in death overs among all teams. @NorthantsCCC have the worst ball per wicket ratio in death overs.
@DurhamCricket concedes the least % of its runs in boundaries while @SomersetCCC concedes most in death overs among all teams. @NorthantsCCC have the worst ball per wicket ratio in death overs.

@leicsccc concedes least in the death overs while @SomersetCCC concedes most in the death. While @Middlesex_CCC and @WorcsCCC concede around 10 per over in the death and are in need of improvement in bowling performances. 

Please let me know your feedback :)
@swashbuckling50 @hganjoo153 @nilesh14 @CricketPanda @DanCricket93 @SAAdvantage @Thecricketconn1 @guerillacricket @CricRicky @SkyCricket @analysis_si @CricXtasy @Cricthoughts03 @ChangeTheOvers @davocafc
@swashbuckling50 @hganjoo153 @nilesh14 @CricketPanda @DanCricket93 @SAAdvantage @Thecricketconn1 @guerillacricket @CricRicky @SkyCricket @analysis_si @CricXtasy @Cricthoughts03 @ChangeTheOvers @davocafc
@threadreaderapp unroll please
• • •
Missing some Tweet in this thread? You can try to
force a refresh


