We have now dropped to just 914 confirmed cases over the last 7 days. That's 130 cases per day. 1.48 cases per county per day. If we go with total numbers over 14 days, we're at 2.9 cases per county per day.
Our percentage of 'probable' cases has continued to remain high. As a reminder to those who critique my focus on the ridiculousness of continuing to count 'probables' as full cases, I direct their attention to fda.gov/medical-device…
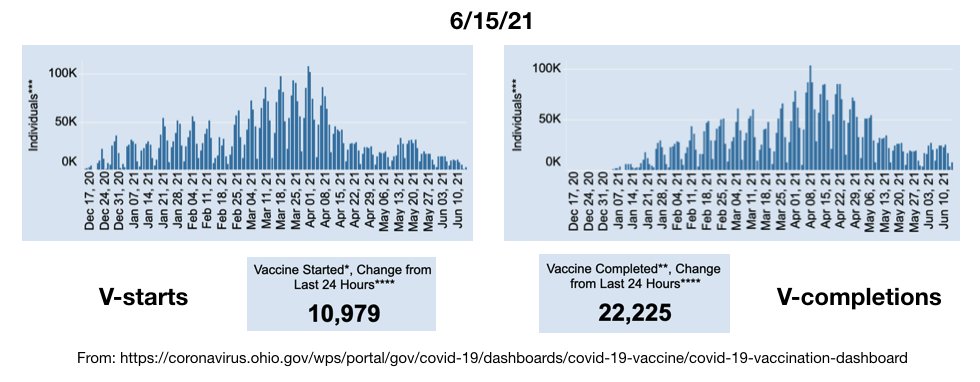
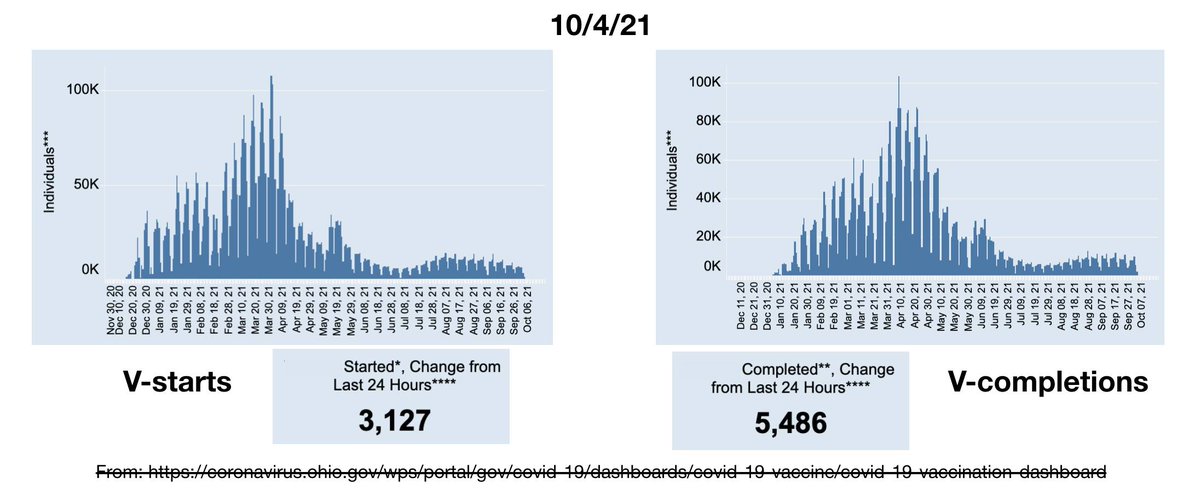
Our vaccinations have, as expected, continued to fall, though today's reported numbers have bounced up from yesterday's record lows. And again, these numbers will be interesting to watch after Friday's 'emergency' meeting about myocarditis.
⭐️🧵 - No one can seem to find all of the new hospital admissions that the CDC is counting.
A study of the Columbus area data.
When I think the absurdity must have reached its peak, I dig a little deeper and find even more impressive ridiculousness.
Today, I looked at CDC’s Health Service Area that includes Franklin (Columbus), Delaware, Madison, Fayette and Pickaway counties - a region that contains over 1.6 million residents and several major hospital systems.
Here we go again, the state is suddenly 'on fire' with COVID. Counties, institutions and businesses are suddenly reissuing mask mandates/advisories and panic is already ensuing.
Why?
Because this week's CDC Map of Fear update was a doozy, with most of the state now being at yellow (medium) and orange (high) alert levels (see below).
Let's talk about yesterday's VRBPAC meeting where they recommended authorizing M0dern@ for children from 6-17 years old.
The data supporting such an authorization is scant, to say the least, and yet they still did it by playing as many games as they could.
We already know that many of those same games will be played later today when they authorize both Pf* and M0dern@ for children between 6 months and 4 years.
Along with yesterday's admission that cases were declining, Dr. Vanderhoff also announce a new adjustment to how we will count 'cases' going forward.
First of all, Ohio has one of the most expansive 'case' definitions (if not THE most expansive) of any state. We count all PCR positives, regardless of symptoms or contact like other states. But we also count 'probables' as full 'cases'.
Most other states separate these 'probables' from the confirmed by PCR cases. Not Ohio. They are full and equal 'cases' with symptomatic, low cycle threshold PCR positives.
🧵Well, yesterday, Dr. Vanderhoff in his press conference finally got with the program and said "We are seeing early indicators that cases appear to be peaking and beginning to point toward a decline."
.....
.....
.....
I'm so glad he's so timely with that information. Although to anyone who actually looks at the data itself, it's been pretty clear for weeks now that we are declining.
Not 'starting', not 'early indicators' not 'appears' - it's right there, glaringly obvious, nothing but their own data, attached to this post and a hundred others just like it for all to follow along.
So here's a thought experiment as we watch the v-starts continue to fall with no sign of any increased interest from those who have yet to take it.
It has been put out there in the new models that having 68% of people injected is a 'low' coverage number for their calculations, while 83% (for the moment) is their goal.
But what does that mean in terms of how long it will take at our current rate of V-uptake?