I love my #dslr camera - though phones are amazingly convenient and that means a lot in photography, nothing beats physics and light-gathering.

Quick comparison.

I was standing, looking at this building. There is a window washer 150m away.

.../
/2

There he is. Here, I'm using my phone camera's natural "5x zoom" lens
/3

Lets use the Samsung-marketed "superzoom!" I can.. well... I can see him.

The phone is doing what it can with its tiny sensor and algorithms. But see that bucket? let's pull out my DSLR.
/4

i can read the bucket from 150m away! (Cropped to hide identity)
/5

extreme zoom:

WARNING! Children can fall into bucket and drown.

(important safety information btw).
Photography is such a great hobby, and if using a phone and its capabilities is what gets you into it, great! There are things you can do with phones that are incredible.

But in photography, photons and sensor size matter!

• • •

Missing some Tweet in this thread? You can try to force a refresh
 

Keep Current with Tyler Black, MD

Tyler Black, MD Profile picture

Stay in touch and get notified when new unrolls are available from this author!

Read all threads

This Thread may be Removed Anytime!

PDF

Twitter may remove this content at anytime! Save it as PDF for later use!

Try unrolling a thread yourself!

how to unroll video
  1. Follow @ThreadReaderApp to mention us!

  2. From a Twitter thread mention us with a keyword "unroll"
@threadreaderapp unroll

Practice here first or read more on our help page!

More from @tylerblack32

17 Jun
So Monica Gandhi and Kyle Hunter made a few mistakes in their piece on kids and the pandemic, specifically in suicidology. With additional context, a lot of their points about MH and the pandemic specifically melt away. I'll enumerate them.

/1
First, she claims that there was an increase of 24% child suicides in california (by rate it's 24-27%) in 2020. She points to data for 2019, 2018, 2017 to show that this is an anomaly.

/2
In fact, this is true. However, some additional context (or, had she consulted a suicidologist) sort of undermine this argument. The suicide rate has increased by 24% or more 4 times prior to 2020 in the past 20 years, and does so with a regular frequency.

excel data, CDC

/3
Read 16 tweets
11 Jun
Thread:

The CDC made a large mistake in their recent publication. It took data from "nonsuicidal self injury" and "suicide attempts" and combined them to create a metric "suspected suicide attempts."

This is stigmatizing and wrong. I will explain why.

Non-suicidal self injury is a phenomenon that happens in adolescence at a high rate. About 12 to 20% of adolescents and young adults engage in non-suicidal self-injury yearly.

It is **not** suicidal. It differs from suicide in many ways.

/2
Non-suicidal self-injury (NSSI):
* Is recruited for therapeutic purpose
* usually involves superficial injuries that do not threaten life
* usually provides relief (as reported by those who do it)
* When we ask kids, they are clear. "IT MAKES ME FEEL BETTER*

/3
Read 6 tweets
11 Jun
Hey CDC if your article is about suicide attempts why did you present data about nonsuicidal self harm?

Shocked to see the CDC make such an elementary mistake in its titles and headlines, and it was a great opportunity to separate the two **very different** phenomena.
Nonsuicidal self harm is a coping mechanism. It's intent is to feel better, not die. It's a sign of distress and ineffective/failing coping mechanisms and usually people with it are suffering but want to live. It's very common in adolescence. (10 to 22% depending on survey).
Suicide attempts are gestures or actions intentionally taken with the purpose to die. They are signs of hopelessness and overwhelming distress, and represent a much smaller group of kids. By survey, about 6 to 8%, by ER presentation about 2%.
Read 5 tweets
11 Jun
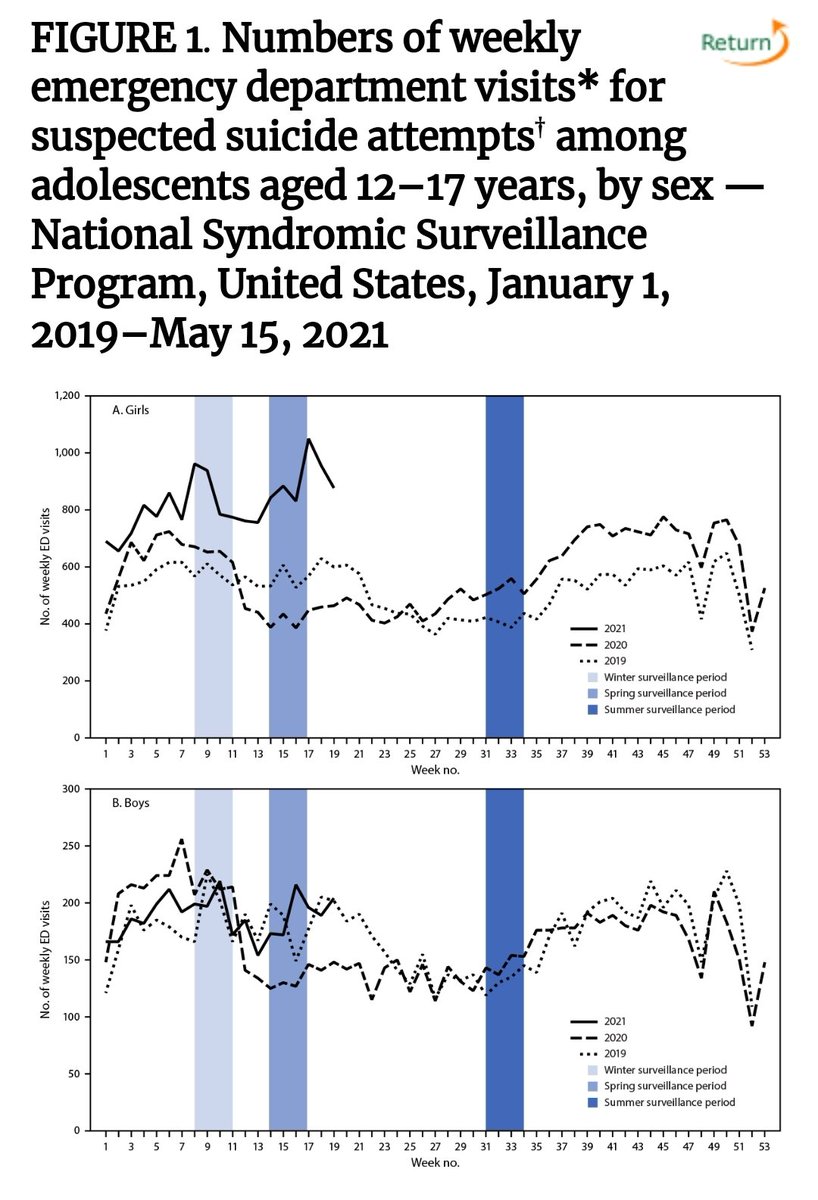
Biiiiig separation between boys and girls in the US for ER presentations for suicide attempts. Very average-to-highish year for boys, big difference for girls. Amplification not surprising: Girls are more likely than boys to gesture/attempt suicide, boys are more likely to die.
The same was not seen (or as dramatically so) in slightly older people (18 to 24)
Please note reports like this do not support your pet theory on what caused it. The increases in pediatric have been continuing since 2015 (30 to 50% year over year) and the pandemic/Lockdowns/whatever may or may not have had an influence on it. Causes yet to be determined.
Read 5 tweets
10 Jun
A Thread with Nuance!!

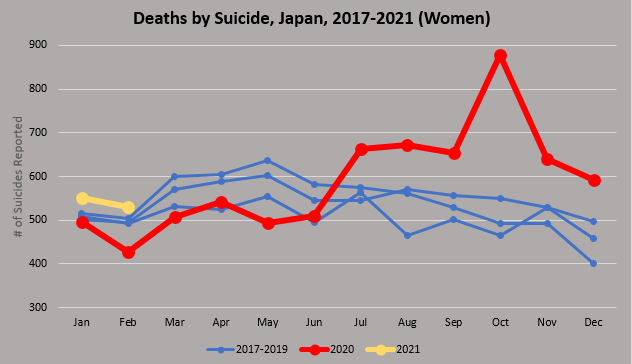
Because the media is obsessed with Japanese suicide data ("suicidal" Japan is a lazy, one-sided trope in Western news), I'd like to add nuance.

First, here are the graphs for who suicides in Japan for the past 5 years, to February 2021! /1 A graph showing suicides for men and women in Japan (approxi
If we zoom into the men, we can see that there was a decrease in early 2020, an increase at the end, and things are back to normal-ish for 2021. In fact, 2021 is a record low for January and 2nd lowest for February. /2 As described in the tweet.
If we zoom into the women, we can see that there is again an early mild decrease followed by a SUBSTANTIAL increase at the end of 2020. Though things are still elevated in Jan-Feb 2021, much less so and hopefully on the way to normalizing. /3 As described in the tweet.
Read 16 tweets
6 Jun
1/ CW: abuse (please read only if you feel in a good space to, this stuff is tough, but it's important data). Statistics from #TX don't show the predicted "major spike" in child abuse fatalities during the pandemic.

Contd: Graph showing the # of child abuse/maltreatment fatalities i
2/ Every child death by abuse, neglect, and wrongful supervision is a tragedy. In no way am I underplaying the importance of these deaths. I'm simply pointing out that the increase is not some kind of previously-unseen thing. It's definitely no tsunami.
3/ evidence:

a) as evidenced, the number is quite "noisy" (standard deviation is 35), and the # of deaths falls between the min (151, 2014) and the max (280, 2009)

b) the rate change is lower than most recent years (its lower than 6 and higher than 8 of the past 14 years) I created this Excel graph to demonstrate the years for whic
Read 6 tweets

Did Thread Reader help you today?

Support us! We are indie developers!


This site is made by just two indie developers on a laptop doing marketing, support and development! Read more about the story.

Become a Premium Member ($3/month or $30/year) and get exclusive features!

Become Premium

Too expensive? Make a small donation by buying us coffee ($5) or help with server cost ($10)

Donate via Paypal Become our Patreon

Thank you for your support!

Follow Us on Twitter!

:(