The annual population estimate from the ONS has just been published, and shows a 0.4% increase across the UK (from June 19 to June 20) to 67.1m. That's the lowest growth rate since 2001.
For those of us looking at age bands to work out vaccine take-up rates, the biggest increase is in the 75-79 group, (+3.6% for England) which has previously been an anomaly with take-up over 100%.
2/
Mid year to mid year, there's the lowest natural change (births less deaths) for at least 38 years. This is due to fewer births and more deaths (up 13% - the highest in 34 years).
Net international migration makes up the balance of the overall increase.
3/
Continuing a trend for several years, London sees the largest outflow of residents, being around 1% of the population in the latest year, very slightly up on the previous year.
4/
🏴had the largest increase last year, just ahead of 🏴. Is that the great rugby, the glorious weather, or the removal of the M4 tolls in Dec 18 I wonder?
In contrast,🏴 had the lowest increase.
5/
London has by far and away the lowest median age, around 5 years lower than many areas - that's important when considering the roll out of the vaccine.
In contrast the SW is the oldest, 8 years higher than London.
6/
There's a neat little interactive tool you can play around with to compare your area with another.
7/
Next year's update will use the results of the recent census, adjusted for the period between the census date to the end of June.
7/7
• • •
Missing some Tweet in this thread? You can try to
force a refresh
A great thread on the state pension and National Insurance.
For me, the trailed abolition of NI and thus its replacement by general taxation in terms of funding state pension benefits will have a major generational redistribution of tax.
It’s been the case that (in aggregate) at any one time the working generation funds the SPs of the retired generation above it.
2/
If the abolition of NI results in an increase (albeit smaller - else why bother) in income tax, whilst those in work will in total be better off, pensioners will be worse off.
3/
The Pensions & Lifetime Savings Association has updated its guide to living costs in retirement. The full report is well worth a read, and goes into a lot of detail.
One key point is that it assumes that pensioners own their home outright - probably reasonable now, but the shift to renting means that in future years that may become increasingly questionable.
2/
It focuses on retirement income, but note that other sources may be used to fund retirement, whether it be income from savings/investments, or gradual withdrawal of capital. Much more likely to be relevant for those aspiring to a comfortable lifestyle of course.
3/
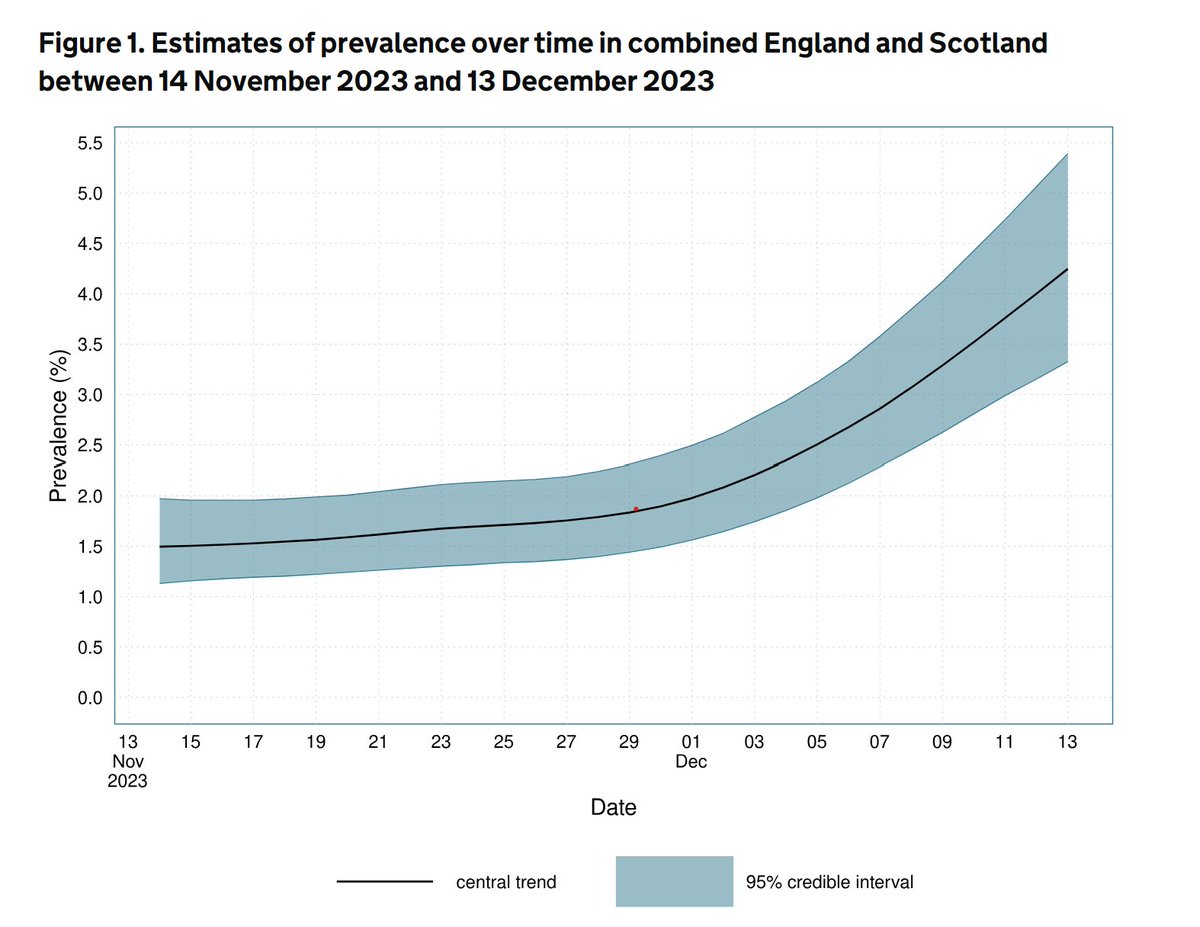
UKHSA estimates that prevalence of COVID in England and Scotland has nearly tripled in the month since the ONS restarted its COVID infection surveillance.
Fortunately prevalence is lowest at the oldest, more vulnerable age groups, but is estimated at just under 6% in the 18 to 44 age groups.
2/
Prevalence is estimated to be highest in the London area, at just over 6% across the population. Note though that confidence intervals are wider due to lower sample sizes than in previous studies.
So with the news this morning that the earnings growth announced today means the state pension (SP) will very likely increase by another 8.5% next year, it's time to set out once again why the SP triple lock (TL) is such a bad idea.
1/
It's all down to cherry-picking the best of the three rates each year. I did a thread nearly a year ago, that hopefully sets out clearly how the mechanism inevitably means that the SP will grow over time against both earnings (E) and prices (P).
With BH's still distorting individual weeks' figures, the cumulative position gives a better view, with the latest CMI age-standardised analysis showing mortality 3.8% (of a full year's mortality) worse than its reference year of 2019.
Here's the mea culpa - it was only wrong by a factor of 13, but at least the post has been deleted rather than just corrected and left up, when experience shows that only a fraction of the original audience will see the correction.
So what are the true numbers?
2/
In E&W the peak week in 2020 was just under 9,000, and the second wave peak was pretty close to that number.
In total ONS has recorded 199,728 COVID related deaths in E&W since the pandemic started.