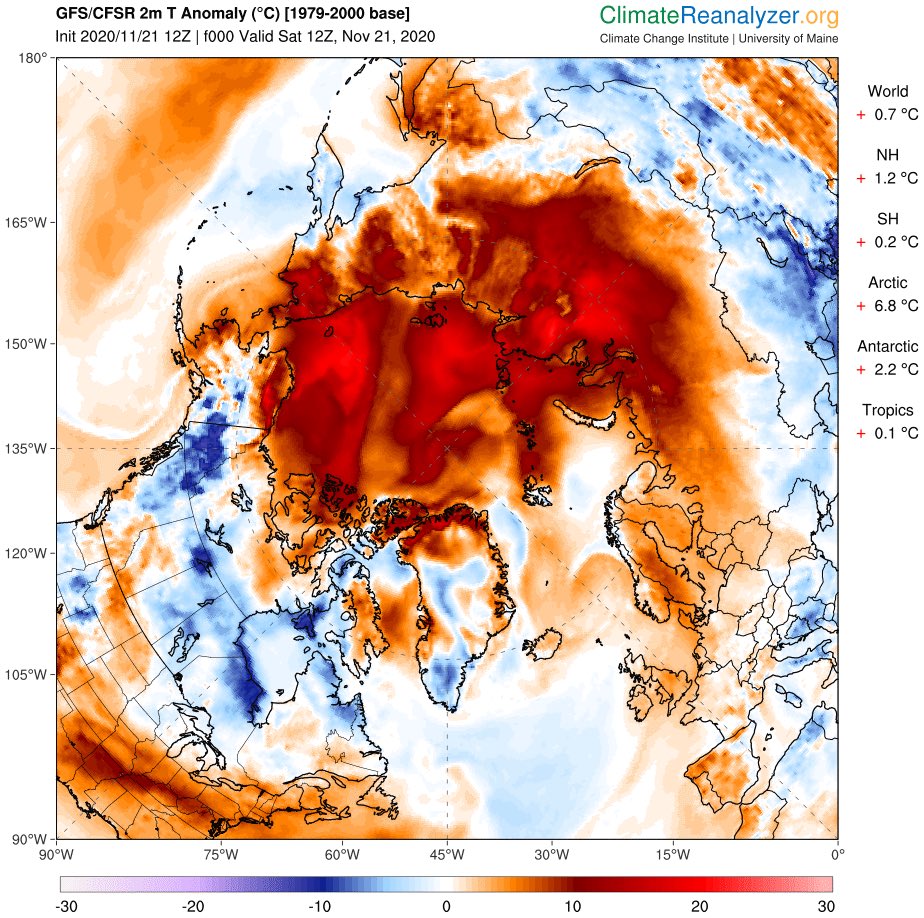
To put climate extremes into perspective we measure against the average. The sigma is the standard deviation of a normal distribution of expected values. In this case the heat dome sigma max is 4.4 - that means it's outside of 99.99% of expected values or a 1/10,000+ chance (1/2) 

Now once you get into the extreme tail of a distribution (in this case right side) numeric chances are very sensitive to slight changes. But it seems accurate to say that a heat dome (thickness of heat column in this "specific spot") is a 1/1000 yr event or greater. Continued...
Of course that is the historical probability... Climate heating is making this a lot more likely. And the fact that we have seen two historic heat waves in the West in back to back weeks is evidence of that. Now of course, in certain natural patterns the West is prone to these..
...intense heat domes, but the background of climate heating pushes them into rare, if not unheard of, territory. And then there is the question of the "wavy" jet stream, which we have now. There's still debate about whether climate change is increasing the wavy jet & "blocks"...
Scientists like @rahmstorf @MichaelEMann have argued in their research related to what they call quasi resonant amplification that the current generation of models is not capturing a real-world climate connection. advances.sciencemag.org/content/4/10/e…
More on my wall... twitter.com/WeatherProf Because I am clearly not capable of producing a cohesive thread and somehow screwed that up ughhh
• • •
Missing some Tweet in this thread? You can try to
force a refresh


