Charles Gaba ✡️ Profile picture
Jun 30, 2021 33 tweets 8 min read Read on X
📣 It's been a few weeks since I ran the county-level plots so I figure it's time to update them.

NOTE: I've expanded the Y-axis from 70% out to 90% of the entire population, which is the highest you could conceivably get to if limited to ages 12+.

CALIFORNIA. R^2: 0.7581.
ALABAMA.
Vaccination rates only range from 14 - 41%.
KANSAS.
Anyone know if there's anything special about Graham County (pop. 2,500)?
NEW MEXICO.
WOW! Go McKinley County, Go! They've *fully* vaccinated over *85%* of their ENTIRE population (not just adults)!
PENNSYLVANIA.
Philadelphia really has to up their game.
WEST VIRGINIA.
A few months ago they led the country. Now...not so much.
ILLINOIS.
Jo Daviess county is an outlier for some reason...population 21,000...any thoughts?
MICHIGAN.
I've overlaid a breakout of the City of Detroit from the rest of Wayne County. A bit depressing I'm afraid.
TENNESSEE.
WYOMING.
R^2: 0.8315.
ALASKA.
Alaska is kind of all over the place, but AK residents have told me that's to be expected--very unusual geography, demographic mix, and even their population center methodology is odd--they don't have "counties," they have "boroughs" and then a bunch of "census areas."
IDAHO.
MAINE.
R^2: 0.8141
NEVADA.
OKLAHOMA.
WISCONSIN.
ARIZONA. Go Santa Cruz!
IOWA (in addition to expanding the Y-axis out to 90%, I've also started adding the "herd immunity" range starting at 80% to give a better sense of how far/close the target is for each county):
MINNESOTA.
KENTUCKY.
MISSOURI.
NEW YORK.
ARKANSAS.
COLORADO. R^2: 0.7073
San Juan & Mineral County doing well!
CONNECTICUT, DELAWARE, DC, HAWAII & RHODE ISLAND
(none of them have more than 8 counties so it seemed a bit silly to give each one its own graph)

Note: Kelawao County, Hawaii only has 86 residents. Still, good for them!
FLORIDA. Adding the herd immunity zone puts even Sumter County in perspective (that's where "The Villages," the massive MAGA retirement community, is located)
GEORGIA.
INDIANA.
LOUISIANA. West Feliciana way out ahead, interestingly.
MARYLAND.
MASSACHUSETTS. Even in the bluest states the pattern is still there, if only faintly...
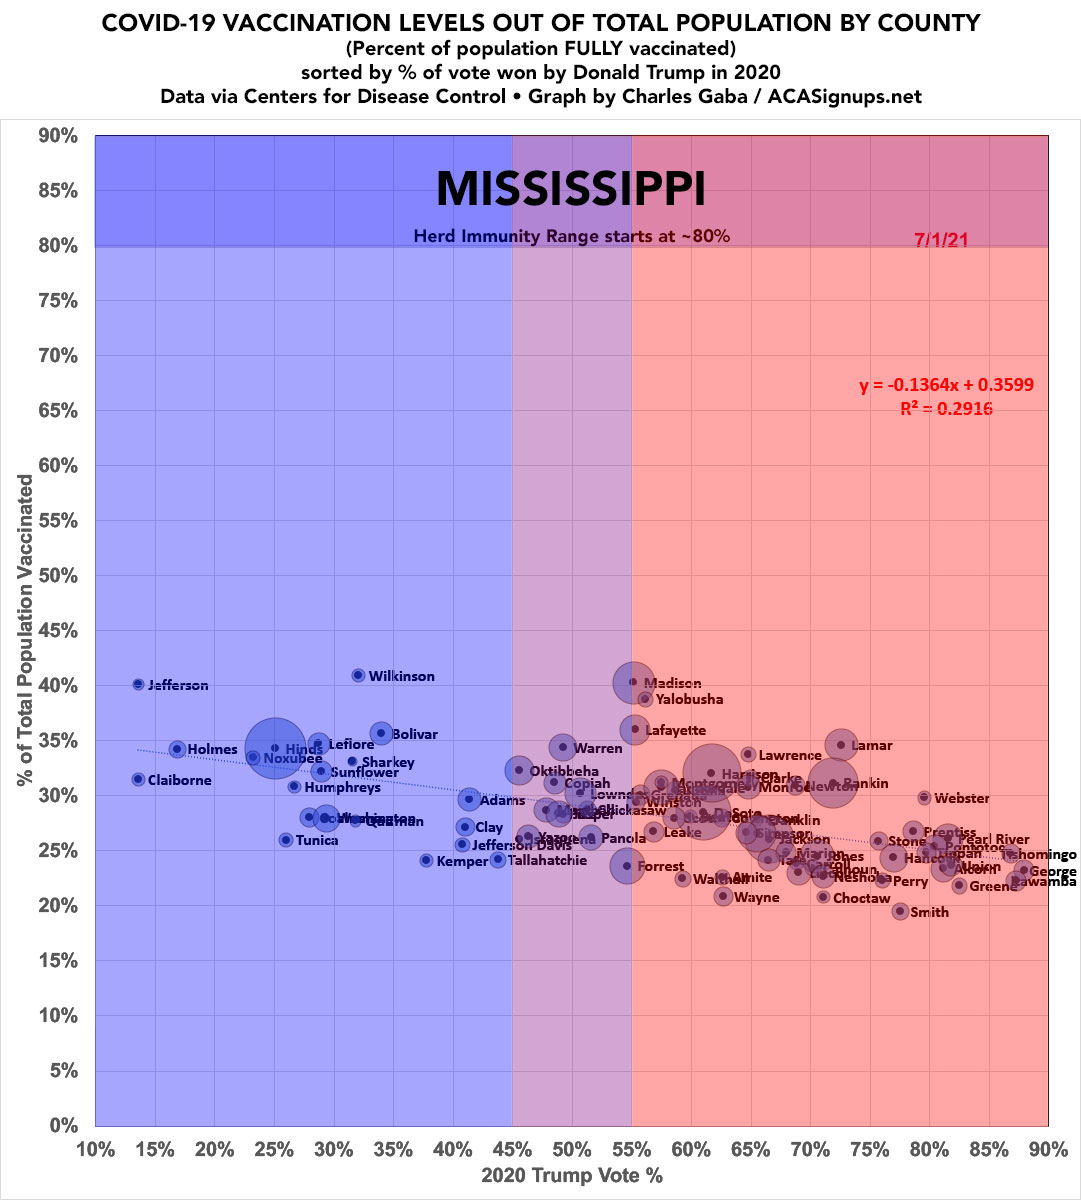
MISSISSIPPI.
Not good. Not good at all.
MONTANA.
R^2: 0.7074

• • •

Missing some Tweet in this thread? You can try to force a refresh
 

Keep Current with Charles Gaba ✡️

Charles Gaba ✡️ Profile picture

Stay in touch and get notified when new unrolls are available from this author!

Read all threads

This Thread may be Removed Anytime!

PDF

Twitter may remove this content at anytime! Save it as PDF for later use!

Try unrolling a thread yourself!

how to unroll video
  1. Follow @ThreadReaderApp to mention us!

  2. From a Twitter thread mention us with a keyword "unroll"
@threadreaderapp unroll

Practice here first or read more on our help page!

More from @charles_gaba

Nov 10
Here's an updated version of my "Dem Stop the Steal!" conspiracy theory thread which hopefully is less scattershot.

There's 3 main claims:

1. "How could there be 20M fewer voters than in 2020 w/"record-breaking turnout?"

2. "How could 15M fewer voter for Harris vs. Biden?"
3. "How could so many swing state voters vote for the Dem for Senate but not for Harris for POTUS?"

There's a few others, but these are the biggest ones, so let's tackle them first:
1. There weren't 20M fewer voters.

I've been compiling the data as it's being updated by CNN's tracking center via a Google spreadsheet. As of this writing, total POTUS turnout is ~147.6M, or ~10.8M lower than 2020's 158.4M.

cnn.com/election/2024/…

docs.google.com/spreadsheets/d…
Read 46 tweets
Nov 8
Yesterday I posted a thread digging into the actual data behind the "20M missing votes!" and "15M fewer than Biden!" conspiracy theories being tossed around the past few days.

I've updated my spreadsheet using the latest data from CNN:
cnn.com/election/2024/…Image
Short Version:

Via CNN, as of this writing, total 2024 POTUS votes are only down 13.9 million vs. 2020...with a likely 11.5 - 12.0 million ballots still to be counted across 30 states.

Total 2024 turnout will likely be ~156M or so...just a couple million fewer than 2020.
Again, using CNN's data & estimates, once every legitimate ballot has been counted, Trump will likely have around ~78 million votes to Harris' 75-76 million.

That'd mean he added ~4 million vs 2020 while she lost ~5-6 million.

Both of these would still suck, of course.
Read 14 tweets
Nov 3
As the guy who obsessed over precisely this data for nearly 3 years, let me address this:

My best estimate is that around 150,000 more Trump 2020 voters than Biden 2020 voters died between Nov. 2020 & Nov. 2022.

That's a lot of people. HOWEVER... 1/

acasignups.net/22/09/17/eleph…
...the vast majority of this discrepancy happened in districts/counties which were heavily red to begin with, which is why the MAGA COVID Death Cult factor only ended up making a decisive difference in exactly one statewide race: Arizona Attorney General:
acasignups.net/22/12/29/updat…
At the House district level it didn't make a decisive difference in any races at all. To understand why, let's look at two extreme examples...

acasignups.net/22/12/13/updat…
Read 10 tweets
Oct 31
People have started asking why I'm still pushing fundraising for Dems just 5 days before Election Day. All the ad time has been purchased & the lit pieces printed & mailed out already, right?

There's several reasons: 1/
1. For state legislative races in particular, a last-minute cash infusion of even $50 can mean an extra few pizzas for tired & hungry canvassers or an extra burner phone for phone banking.

Blue24.org/state-leg
2. After the polls close, there's going to no doubt be some races which require recounts...which may or may not have to be paid for by the campaign requesting it, depending on the state and the margin. That's gonna cost money.

Blue24.org/endgame
Read 4 tweets
Oct 31
🧵THE DEAD POOL: Since @MikeJohnson and @JDVance are promising to Concentrate folks w/pre-existing conditions into separate Camps, let's talk about that. 1/
acasignups.net/24/10/04/dead-…
Let's go back to the pre-ACA healthcare landscape. This is what it looked like in 2012...*before* the ACA's major provisions went into effect.

Half the US had employer coverage. Another third had Medicare or Medicaid. ~11M had "individual" insurance; ~48M had nothing at all. 2/ Image
The ACA had 2 main goals:

1. Reduce the number of uninsured Americans as much as possible by making coverage more affordable & accessible;

2. Provide protections from insurance industry abuses, *especially* for the individual market where the abuses were the most blatant. 3/
Read 40 tweets
Oct 6
(sigh) OK, here we go again: Trump's Butler, PA rally crowd size.

Here's the best aerial view shot I've seen of the crowd at its peak. (the arrow shows the stage). 1/ Image
A standard dry U.S. trailer van is around 53' long. 2/
schneiderjobs.com/blog/semi-truc…
As it happens, the aerial shot shows several presumably standard trailer vans lined up neatly in a row just outside the perimeter in the lower right.

By copying & pasting one of them, it looks like the venue runs around 7 trailer vans x 4 trailer vans. 3/ Image
Read 9 tweets

Did Thread Reader help you today?

Support us! We are indie developers!


This site is made by just two indie developers on a laptop doing marketing, support and development! Read more about the story.

Become a Premium Member ($3/month or $30/year) and get exclusive features!

Become Premium

Don't want to be a Premium member but still want to support us?

Make a small donation by buying us coffee ($5) or help with server cost ($10)

Donate via Paypal

Or Donate anonymously using crypto!

Ethereum

0xfe58350B80634f60Fa6Dc149a72b4DFbc17D341E copy

Bitcoin

3ATGMxNzCUFzxpMCHL5sWSt4DVtS8UqXpi copy

Thank you for your support!

Follow Us!

:(