Kathryn Huwig's 'Beyond the Data' Profile picture
Jun 30, 2021 6 tweets 2 min read Read on X
Tuesday's new reported data again shows a bump in the near term probables. Right on time with the beginning of the work week. Purely coincidental, I'm sure.

We are now down to just 167 total cases per day for the whole state, just 1.90 total cases per county per day. Image
Confirmed cases in the last 7 days have also dropped to their lowest point, with just 98 confirmed cases per day.

⭐️ That's 1.11 cases per county per day. Image
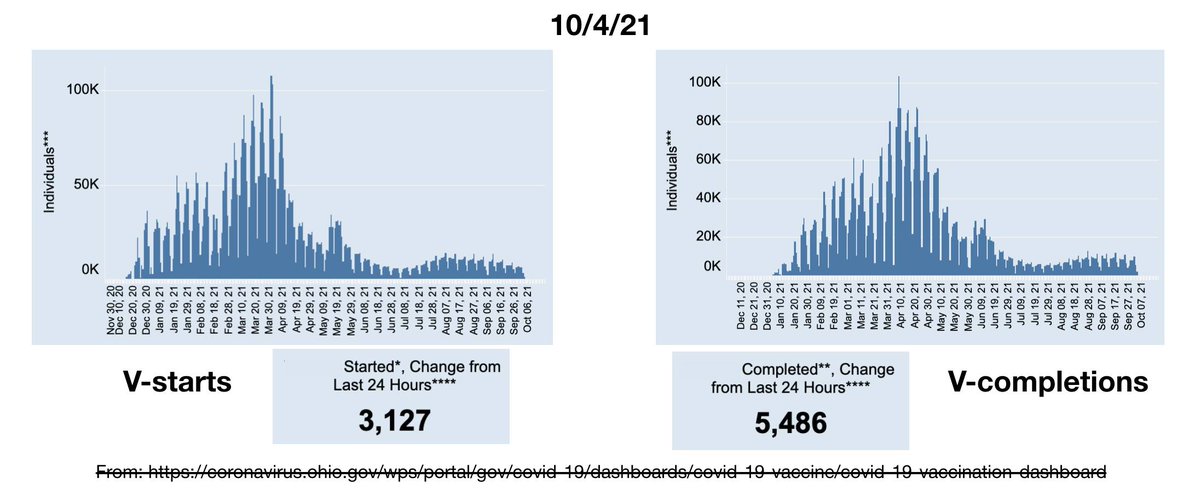
Our new V-starts keep following the dropping trend - no wonder Gov. DeWine no longer wants to talk about COVID - there's nothing scary to report, and no good news about the Big V either. Image
See cleveland.com/.../end-of-an-…... for more info on that, and don't worry - he'll be back when the scariants come along.
Image
Image

• • •

Missing some Tweet in this thread? You can try to force a refresh
 

Keep Current with Kathryn Huwig's 'Beyond the Data'

Kathryn Huwig's 'Beyond the Data' Profile picture

Stay in touch and get notified when new unrolls are available from this author!

Read all threads

This Thread may be Removed Anytime!

PDF

Twitter may remove this content at anytime! Save it as PDF for later use!

Try unrolling a thread yourself!

how to unroll video
  1. Follow @ThreadReaderApp to mention us!

  2. From a Twitter thread mention us with a keyword "unroll"
@threadreaderapp unroll

Practice here first or read more on our help page!

More from @ohio_data

Aug 5, 2022
⭐️🧵 - No one can seem to find all of the new hospital admissions that the CDC is counting.

A study of the Columbus area data.
When I think the absurdity must have reached its peak, I dig a little deeper and find even more impressive ridiculousness.
Today, I looked at CDC’s Health Service Area that includes Franklin (Columbus), Delaware, Madison, Fayette and Pickaway counties - a region that contains over 1.6 million residents and several major hospital systems.
Read 24 tweets
Jul 25, 2022
🧵 - Perspective.

Is Ohio 'on fire' with COVID right now?
Here we go again, the state is suddenly 'on fire' with COVID. Counties, institutions and businesses are suddenly reissuing mask mandates/advisories and panic is already ensuing.
Why?
Because this week's CDC Map of Fear update was a doozy, with most of the state now being at yellow (medium) and orange (high) alert levels (see below).
Read 18 tweets
Jun 15, 2022
🧵⬇️

Let's talk about yesterday's VRBPAC meeting where they recommended authorizing M0dern@ for children from 6-17 years old.
The data supporting such an authorization is scant, to say the least, and yet they still did it by playing as many games as they could.
We already know that many of those same games will be played later today when they authorize both Pf* and M0dern@ for children between 6 months and 4 years.
Read 23 tweets
Oct 6, 2021
⭐️⭐️⭐️⭐️⭐️⭐️⭐️⭐️⭐️⭐️⭐️

🧵Because Ohio's COVID 'case' definition isn't expansive enough..

Along with yesterday's admission that cases were declining, Dr. Vanderhoff also announce a new adjustment to how we will count 'cases' going forward.
First of all, Ohio has one of the most expansive 'case' definitions (if not THE most expansive) of any state. We count all PCR positives, regardless of symptoms or contact like other states. But we also count 'probables' as full 'cases'.
Most other states separate these 'probables' from the confirmed by PCR cases. Not Ohio. They are full and equal 'cases' with symptomatic, low cycle threshold PCR positives.
Read 17 tweets
Oct 5, 2021
🧵Well, yesterday, Dr. Vanderhoff in his press conference finally got with the program and said "We are seeing early indicators that cases appear to be peaking and beginning to point toward a decline."
.....
.....
.....

(video: tinyurl.com/3e2khvxx)
I'm so glad he's so timely with that information. Although to anyone who actually looks at the data itself, it's been pretty clear for weeks now that we are declining.
Not 'starting', not 'early indicators' not 'appears' - it's right there, glaringly obvious, nothing but their own data, attached to this post and a hundred others just like it for all to follow along.
Read 9 tweets
Jul 7, 2021
So here's a thought experiment as we watch the v-starts continue to fall with no sign of any increased interest from those who have yet to take it.
It has been put out there in the new models that having 68% of people injected is a 'low' coverage number for their calculations, while 83% (for the moment) is their goal.
But what does that mean in terms of how long it will take at our current rate of V-uptake?
Read 7 tweets

Did Thread Reader help you today?

Support us! We are indie developers!


This site is made by just two indie developers on a laptop doing marketing, support and development! Read more about the story.

Become a Premium Member ($3/month or $30/year) and get exclusive features!

Become Premium

Don't want to be a Premium member but still want to support us?

Make a small donation by buying us coffee ($5) or help with server cost ($10)

Donate via Paypal

Or Donate anonymously using crypto!

Ethereum

0xfe58350B80634f60Fa6Dc149a72b4DFbc17D341E copy

Bitcoin

3ATGMxNzCUFzxpMCHL5sWSt4DVtS8UqXpi copy

Thank you for your support!

Follow Us!

:(