New analysis shows there were more UK deaths than births in 2020 - the first time since 1976 and the second time since the start of the 20th century.

The difference between the number of live births and the number of deaths is known as “natural change” ow.ly/Iux050Fpzd6 Chart title: There were more deaths than births in the UK in
Negative natural change occurs when there are more deaths than births, but this might not mean the total size of the population has decreased.

Migration can still lead to overall population growth by more people moving into an area than leaving it ow.ly/19F550Fpzgs
There were more deaths than births since 2015 in Scotland, and since 2016 in Wales.

In England and Northern Ireland, there were more births than deaths up to and including 2020, although differences between births and deaths have been decreasing ow.ly/WFJj50Fpzik Chart title: There were more deaths than births in Scotland
90,173 UK deaths involving #COVID19 were registered in 2020, taking the total number of deaths to 689,629. This is up 14% (84,922) compared with 2019.

The number of births decreased by 4.1% (29,489) compared with 2019 figures, with a total of 683,191 ow.ly/m3TX50FpzkA There were more UK deaths than births in 2020 2019 Births: 7
Taking the total registered deaths and occurrences of births into account, this means that “natural change” in the UK in 2020 was -6,438, down from 107,973 in 2019 and 115,119 in 2018 ow.ly/eXBr50Fpzrt UK natural change (difference between the number of live bir
We’ve also published two releases which look at deaths registered in England and Wales in 2020 and deaths due to #COVID19 in 2020.

Read our thread ⬇️

• • •

Missing some Tweet in this thread? You can try to force a refresh
 

Keep Current with Office for National Statistics (ONS)

Office for National Statistics (ONS) Profile picture

Stay in touch and get notified when new unrolls are available from this author!

Read all threads

This Thread may be Removed Anytime!

PDF

Twitter may remove this content at anytime! Save it as PDF for later use!

Try unrolling a thread yourself!

how to unroll video
  1. Follow @ThreadReaderApp to mention us!

  2. From a Twitter thread mention us with a keyword "unroll"
@threadreaderapp unroll

Practice here first or read more on our help page!

More from @ONS

6 Jul
There were 607,922 deaths registered in England and Wales in 2020 according to new annual mortality data.

This is an increase of 77,081 deaths compared with 2019 ow.ly/aLfp50FpyHj In 2020, the number of deaths in England and Wales increased
For the first time since 1981, there were more male deaths (308,069) registered than female deaths (299,853) ow.ly/ZOeI50FpyPO
Adjusting for age, the highest mortality rates for men and women in England were in the North East for the second consecutive year.

The South West was the region with the lowest ow.ly/zo2D50FpyS5
Read 7 tweets
6 Jul
Provisionally, 8,690 deaths were registered in England and Wales in the week ending 25 June 2021 (Week 25). This was

▪ 769 fewer than Week 24
▪️ 714 fewer than the five-year average for Week 25

➡️ ow.ly/YuuG50FpydX The number of deaths registered was below the five-year aver
1.1% of all deaths registered in Week 25 mentioned #COVID19 on the death certificate (99 out of 8,690 deaths).

This was 3 fewer than the previous week ow.ly/1K2650Fpyhe The number of deaths involving COVID-19 decreased slightly i
97,136 deaths registered involving #COVID19 to date (2020 and up to Week 25 2021) occurred in hospitals. The remainder mainly occurred in

▪️ care homes (32,238)
▪️ private homes (8,060)
▪️ hospices (2,093)

➡️ ow.ly/eG5T50FpykD Total deaths involving COVID-19 to date  Deaths (Week 11 202
Read 7 tweets
2 Jul
#COVID19 infection rates have increased in England, Wales and Scotland, with rates similar to those last seen in February 2021.

These changes are mostly driven by a large increase in the number of cases compatible with the Delta variant ow.ly/czag50FntMa Estimated number of people with COVID-19 in the week ending
#COVID19 cases compatible with the Delta variant have increased across England, Wales and Scotland where this variant continues to be dominant.

In Northern Ireland the trend is uncertain ow.ly/fMZt50FntNN Chart title: The percentage testing positive whose results a
#COVID19 infections have increased across most regions in England, with the highest rates of positive cases in the North East and North West ow.ly/Tn1I50FntQr Chart title: The percentage of people testing positive incre
Read 5 tweets
2 Jul
4% of adults reported hesitancy towards the #COVID19 vaccine between 26 May and 20 June 2021.

This is a slight decrease on the previous period, which reflects a longer-term trend of declining hesitancy ow.ly/pb2i50Fnn2o Hesitancy towards the coronavirus (COVID-19) vaccine has dec
For the first time, we’ve looked at younger age groups and hesitancy towards the #COVID19 vaccine.

86% of those of those aged 16 to 17 reported positive sentiment towards the vaccine, while 14% reported vaccine hesitancy ow.ly/1Mot50Fnn7k Title: COVID-19 vaccine hesitancy is highest for under 18s
Black or Black British adults had the highest rates of vaccine hesitancy (18%) compared with White adults (4%).

Hesitancy was also higher for adults identifying Muslim (15%) as their religion, compared with those identifying as Christian (3%) ow.ly/P2nL50Fnndv
Read 4 tweets
2 Jul
68% of adults always or often socially distanced this week. This has fallen since lockdown restrictions began to lift (85% from 14 to 18 April).

73% avoided physical contact outside the home, similar to last week but down since mid April (86%) ow.ly/EjOc50FnmFz Measures to prevent the spread of COVID-19 Social distancing
49% of adults met indoors with people not in their household or bubble this week, a similar level to the beginning of June (50%).

56% met up outdoors, continuing the fall from 60% last week and 65% in early June ow.ly/cF3j50FnmIV
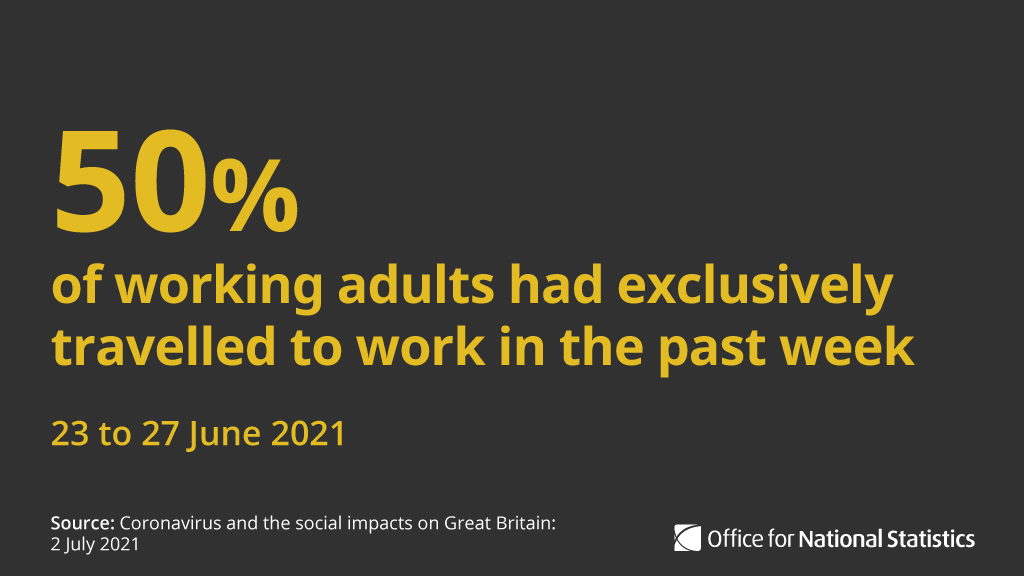
50% of working adults had travelled to work exclusively (and not worked from home) in the past seven days (up slightly from 49% last week).

This proportion has been steadily increasing from 34% in mid-February ow.ly/9Nu950FnmME 50% of working adults had exclusively travelled to work in t
Read 5 tweets
1 Jul
An estimated 962,000 people experienced self-reported long COVID in the 4 weeks to 6 June (where symptoms persisted more than 4 weeks after the first suspected infection) ow.ly/w3E550FmuFw 962,000 people in the UK reported long COVID symptoms 10 May
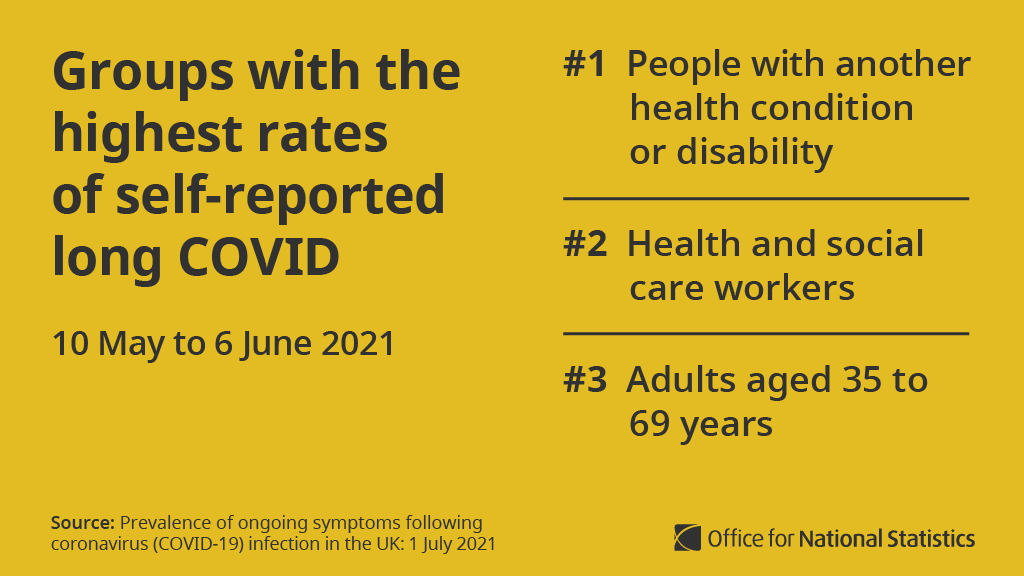
Self-reported long COVID was most likely among people

▪️ aged 35 to 69
▪ who are female
▪️ living in the most deprived areas
▪️ working in health or social care
▪️ with another health condition or disability

➡️ ow.ly/54Oq50FmuNN Groups with the highest rates of self-reported long COVID 10
The most common self-reported symptoms of long COVID were

▪️ fatigue
▪️ shortness of breath
▪️ muscle ache
▪️ difficulty concentrating

➡️ ow.ly/z8of50FmuW0 Most common symptoms among those with self-reported long COV
Read 5 tweets

Did Thread Reader help you today?

Support us! We are indie developers!


This site is made by just two indie developers on a laptop doing marketing, support and development! Read more about the story.

Become a Premium Member ($3/month or $30/year) and get exclusive features!

Become Premium

Too expensive? Make a small donation by buying us coffee ($5) or help with server cost ($10)

Donate via Paypal Become our Patreon

Thank you for your support!

Follow Us on Twitter!

:(