Don't ask me regularly , is share ka kya kre( what to do with this stock )
I always share target ,price ,SL and all details with chart ,follow them.
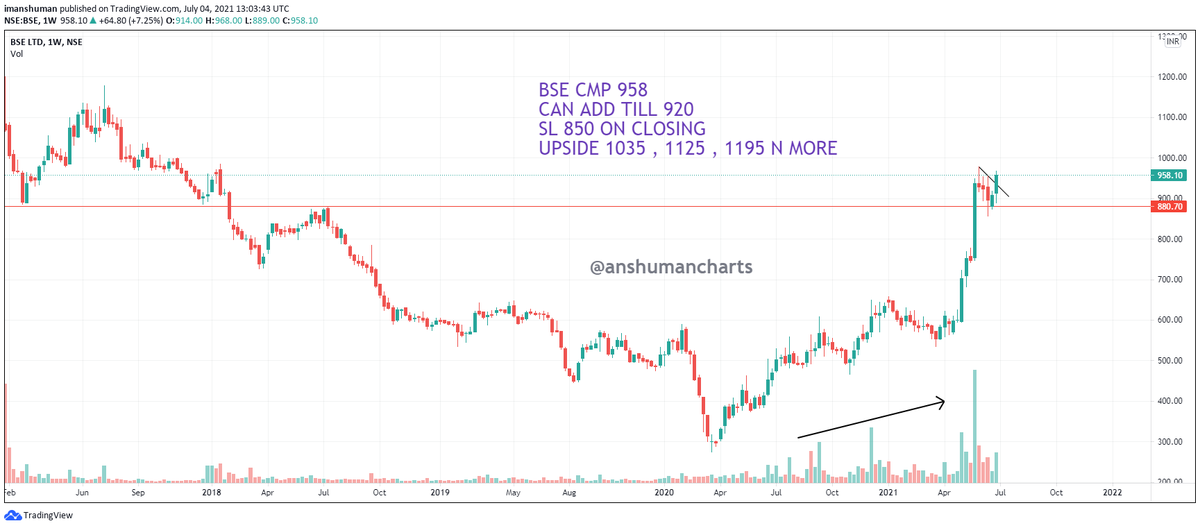
If I share any chart of weekly , time frame is minimum1 to 3 month
If stock is going down few % ,if u hv nt patience don't buy
I always share target ,price ,SL and all details with chart ,follow them.
If I share any chart of weekly , time frame is minimum1 to 3 month
If stock is going down few % ,if u hv nt patience don't buy
All stocks are not same in nature . Some stocks can hit their target in few days and sm stocks can take time.
This is bull run , u r doing so then what will you do when multiple stoplosses are hit?
Before taking any trade do ur own research , i m nt responsible for ur any loss.
This is bull run , u r doing so then what will you do when multiple stoplosses are hit?
Before taking any trade do ur own research , i m nt responsible for ur any loss.
Before taking any trade see ur risk reward , if I shared any stock on X price , u r buying it on x+5 price , I m nt responsible when stop loss is x-5 and current price is X and that is investment pick , not for intraday.
Markets hours me ye sab msgs mood khrab kr deti h.
Markets hours me ye sab msgs mood khrab kr deti h.
• • •
Missing some Tweet in this thread? You can try to
force a refresh