Thread

Basics of Doji Candlestick Pattern

The Doji candlestick pattern is a formation that occurs when a market’s open price and close price are almost exactly the same.

@caniravkaria @SouravSenguptaI @Puretechnicals9
It is formed when the market opens and bullish traders push prices up whereas the bearish traders reject the higher price and push it back down.
It could also be that bearish traders try to push prices as low as possible, and the bulls fight back and push the price up.
The upward and downward movements that happen between open and close form the wick.

The body is formed when the price closes at or almost the same level as it opened.

There are 4 types of Doji candles

Source Elearnmarkets and Investing. com
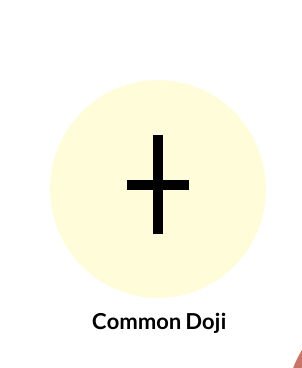
👉Common Doji

This is the most common type of Doji candlestick pattern.

When buying and selling are almost the same, this pattern occurs.

The future direction of the trend is uncertain as indicated by this Doji pattern
👉Long-Legged Doji
As the name suggests this is a long-legged candlestick pattern.

When the supply and demand factors are at equilibrium, then this pattern occurs. The trend’s future direction is regulated by the prior trend and Doji pattern.
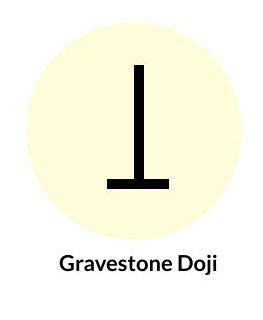
👉Gravestone Doji
This pattern is found at the end of the uptrend when supply and demand factors are equal.

At the day’s low, the candlestick opens and closes. The future direction of the trend is regulated by the prior trend and Doji pattern.
Dragonfly Doji
This pattern appears at the end of the downtrend when the supply and demand factors are at equilibrium.
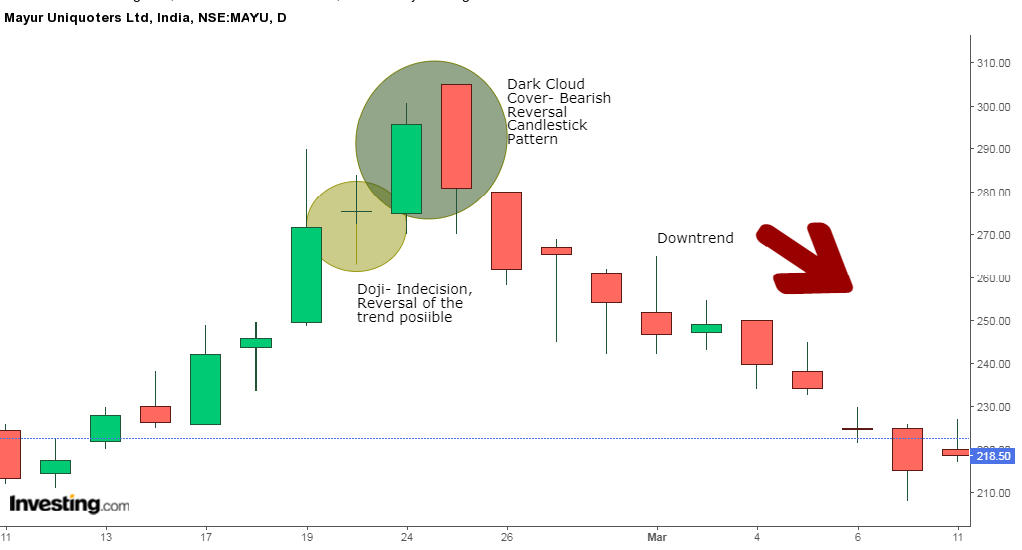
Doji Example:
here Mayur Uniquoters Ltd, we see that at the end of the uptrend a Doji is formed which is indicating that the ongoing trend has become certain. it is then followed by the Dark Cloud Cover candlestick pattern that confirms that the reversal is going to take place

• • •

Missing some Tweet in this thread? You can try to force a refresh
 

Keep Current with AnshumanCharts

AnshumanCharts Profile picture

Stay in touch and get notified when new unrolls are available from this author!

Read all threads

This Thread may be Removed Anytime!

PDF

Twitter may remove this content at anytime! Save it as PDF for later use!

Try unrolling a thread yourself!

how to unroll video
  1. Follow @ThreadReaderApp to mention us!

  2. From a Twitter thread mention us with a keyword "unroll"
@threadreaderapp unroll

Practice here first or read more on our help page!

More from @AnshumanCharts

7 Jul
Basics Of Fundamental Analysis

Fundamental analysis and particularly quantitative fundamental analysis is the searchlight you can use to shine a light on stocks before they catch fire.

@caniravkaria @saketreddy @MashraniVivek @SahilKapoor enlighten us with ur words.
In simple, it measures the intrinsic value of a stock by studying various factors affecting it.
It is the value of a stock as determined by qualitative and quantitative methods of fundamental analysis. The intrinsic value might be higher or lower than its actual market value.
In quantitative analysis, you justify buying stocks by studying the underlying numbers that make a successful company. Simply put, stock prices and shares are numbers. Investment is about maximising those numbers and both these factors depend on the company’s numbers.
Read 22 tweets
6 Jul
Don't ask me regularly , is share ka kya kre( what to do with this stock )
I always share target ,price ,SL and all details with chart ,follow them.
If I share any chart of weekly , time frame is minimum1 to 3 month
If stock is going down few % ,if u hv nt patience don't buy
All stocks are not same in nature . Some stocks can hit their target in few days and sm stocks can take time.

This is bull run , u r doing so then what will you do when multiple stoplosses are hit?

Before taking any trade do ur own research , i m nt responsible for ur any loss.
Before taking any trade see ur risk reward , if I shared any stock on X price , u r buying it on x+5 price , I m nt responsible when stop loss is x-5 and current price is X and that is investment pick , not for intraday.

Markets hours me ye sab msgs mood khrab kr deti h.
Read 7 tweets
6 Jul
TechoFunda Study on Rubfila International CMP 101.95 💰
👉It is the only Indian manufacturer of both Talcum Coated and Silicon Coated Rubber threads
👉ROCE 23.4%
👉ROE 17.1%
👉PE 18.39

@caniravkaria @safiranand @nid_rockz @Anshi_________ @rohanshah619 @saketreddy @RajarshitaS
👉Almost Debt Free
👉healthy dividend payout of 30.18%.
👉Promoter stake increased 1.45% in last quarter and 3.45 % in last year
👉It is a Public Listed Company promoted by Rubpro Sdn. Bhd.,Malaysia along with Kerala State Industrial Development Corporation (KSIDC) and from 1994
Highest in Last 9 Quarter
Net Sales 114.21 Cr
EBITDA 16.06 Cr
PBT 15.32 Cr
Net Profit 11.53 Cr Image
Read 13 tweets
5 Jul
Some important mistakes people do in starting journey of market :-

* Start buying/selling without basic knowledge of market & stocks.
*Always enter at the top, and sell when stock consolidates/retest the support.

@Anshi_________ @Abhishekkar_ @Puretechnicals9 @caniravkaria
* People don't want to learn first , they want to earn first.

* Taking tips from anywhere Ye le lo , Wo le lo

* An emotional attachment to stocks, try to ignore reality

* No plan for capital allocation.
*Trade like market is gambling ,wanted to earn huge money in short time

*More Focus on intraday & FnO , investing sounds them boring.

* Use of leveraged money

*False self belief that they can beat the market

*Selling out running stocks early and holding junks fr long time.
Read 4 tweets
4 Jul
Strong weekly breakouts/retest are -
For medium term(1 to 3 month atleast) CHARTS ATTACHED

BSE
MAITHAN ALLOYS
DR REDDYS LABS
CREST VENTURES
CROMPTON GREAVES
WENDT
JYOTHYLABS
CCL PRODUCTS
KOKUYO CAMLIN
PRIME SECURITIES

Disc - Charts are not recommendation , trade on ur own risk
BSE CMP 958
CAN ADD TILL 920
SL 850 ON CLOSING
UPSIDE 1035 , 1125 , 1195 N MORE Image
MAITHAN ALLOYS
CMP 1085 ADD TILL 1025
SL BELOW 975 ON CLOSING
UPSIDE 1250 , 1400 N MORE Image
Read 11 tweets
27 Jun
Strong weekly breakout/retest stocks
(medium term) Charts are attached

JK PAPER
ANDHRA SUGAR
GINNI FILAMENTS
DCM LTD
UTTAM SUGAR
NCL INDUSTRIES
SHARDA MOTORS
SWARAJ ENGINE

@caniravkaria @shivaji_1983 @Puretechnicals9 @chartmojo @MarketScientist @Anshi_________
Andhra Sugars CMP 498 Add till 460 SL 430
UPSIDE 590 N MORE
GINNI FILAMENTS 35.85 ADD TILL 32.50
SL 29.60 CLOSING
UPSIDE 37.25 , 40 N MORE
Read 9 tweets

Did Thread Reader help you today?

Support us! We are indie developers!


This site is made by just two indie developers on a laptop doing marketing, support and development! Read more about the story.

Become a Premium Member ($3/month or $30/year) and get exclusive features!

Become Premium

Too expensive? Make a small donation by buying us coffee ($5) or help with server cost ($10)

Donate via Paypal Become our Patreon

Thank you for your support!

Follow Us on Twitter!

:(