
Utilities are a great defensive stock in times of uncertainty. And with the renewable revolution underway, electric utilities have a multi-decade long tailwind.
But, Australian utilities have been a value trap. Is there an alternative?
Let’s take a deep dive 👇
But, Australian utilities have been a value trap. Is there an alternative?
Let’s take a deep dive 👇

1. Investment Thesis: Investing in utility stalwarts that are stable during times of recession or equity bubbles.
Not very sexy, but can one get +10% IRR and anchor your portfolio allowing others to do the heavy lifting?
h/t @Alpaca_Capital for suggesting this post
Not very sexy, but can one get +10% IRR and anchor your portfolio allowing others to do the heavy lifting?
h/t @Alpaca_Capital for suggesting this post

2. Let’s define what we mean by utilities. Generally, they are 1) electricity & sometimes gas, 2) telecommunications, or 3) water and sewage.
Today we’re going to focus on #1: electric utilities that may have gas.
Today we’re going to focus on #1: electric utilities that may have gas.

3. Utilities can also be regulated or unregulated. Regulated have rates set by the government, which differs by jurisdiction, and reflects them being a natural monopoly.
Magellan have a good primer on this:
magellangroup.com.au/insights/an-in…
Magellan have a good primer on this:
magellangroup.com.au/insights/an-in…
4. Utilities may also have non-utility like components.
For example, service stream undertake maintenance which is more like a cyclical; whereas others may do infrastructure development (e.g. Tilt Renewables $TLT) which can turbocharge earnings growth.
For example, service stream undertake maintenance which is more like a cyclical; whereas others may do infrastructure development (e.g. Tilt Renewables $TLT) which can turbocharge earnings growth.
https://twitter.com/DownunderValue/status/1382850052268326914
5. Finally, utilities operate across generation, networks, distribution and retail. Gentailers are vertically integrated.
We’re focusing more on the generation and networks as this is where the specific tailwind exists for renewables over the next 10, 20 or even 30 years.
We’re focusing more on the generation and networks as this is where the specific tailwind exists for renewables over the next 10, 20 or even 30 years.

6. Megatrend: There are two key parts.
First, demand is projected to massively increase as we continue to electrify our fleet of vehicles, population grows, median income grows, etc.
First, demand is projected to massively increase as we continue to electrify our fleet of vehicles, population grows, median income grows, etc.

7. Megatrend: Second, substitution away from fossil fuels to renewable electricity is only getting started. We have recently passed the inflection point of renewables being cheaper than fossil fuels. This is not dependent on taxes or subsides, this is pure economics.

8. Huge runway of CAPEX for renewables: The reality is our generators and networks (poles and wires) need upgrading. They’re outdated and inefficient.
And this means there are decades of investing opportunities for electric utilities – unlike most water utilities for example.
And this means there are decades of investing opportunities for electric utilities – unlike most water utilities for example.

9. So that’s the set up.
We have a megatrend of renewables, and are looking at the generation / networks as a way to play it because they’re oligopolies, and we can ignore disruption to a specific tech.
So, what does the return profile look like, and where can we invest?
We have a megatrend of renewables, and are looking at the generation / networks as a way to play it because they’re oligopolies, and we can ignore disruption to a specific tech.
So, what does the return profile look like, and where can we invest?
10. @Cultivatewealth has done all the hard work for us on calculating utility revenue requirements:
=(Rate base * ROE) + operating expenses + depreciation + taxes
enlightenedcapital.substack.com/p/utilities-pr…
=(Rate base * ROE) + operating expenses + depreciation + taxes
enlightenedcapital.substack.com/p/utilities-pr…
11. The major difference between Aus, US and even EU is the ‘ROE’ set by Gov.
Across the US it’s around ~9.5-10.5% with higher CAPEX; in Aus we have higher WACC and lower ROE’s, around ~8.5% gross returns on lower CAPEX; Europeans invest more in emerging markets.
Across the US it’s around ~9.5-10.5% with higher CAPEX; in Aus we have higher WACC and lower ROE’s, around ~8.5% gross returns on lower CAPEX; Europeans invest more in emerging markets.

12. Example of Spark Infrastructure $SKI $SKI.AX – They’re most recent 5yr regulatory determination in Victoria is 8.5% based on 4.73% WACC, leading to lower forecast revenues and margins for their network infrastructure for the foreseeable future.

13. Example of Origin $ORG $ORG.AX – While it’s a vertically integrated gentailer with significant gas, the low and declining ROCE demonstrates part of the point…

14. … the other part being lower CAPEX ($0.5bn p/a on MC of $8bn, 6% p/a) while management extracts the FCF to afford the dividend rather than investing for the future. It's shareholder cannibalism.

15. Example of Dominion $D – Not only do they have higher ROE in the US, sponsored by higher rate cases in the state legislatures…

16 … but they also have significant growth CAPEX planned ($32bn over 5yrs on $60bn MC, 11% p/a) resulting in forecast ~10% Total Shareholder Return.

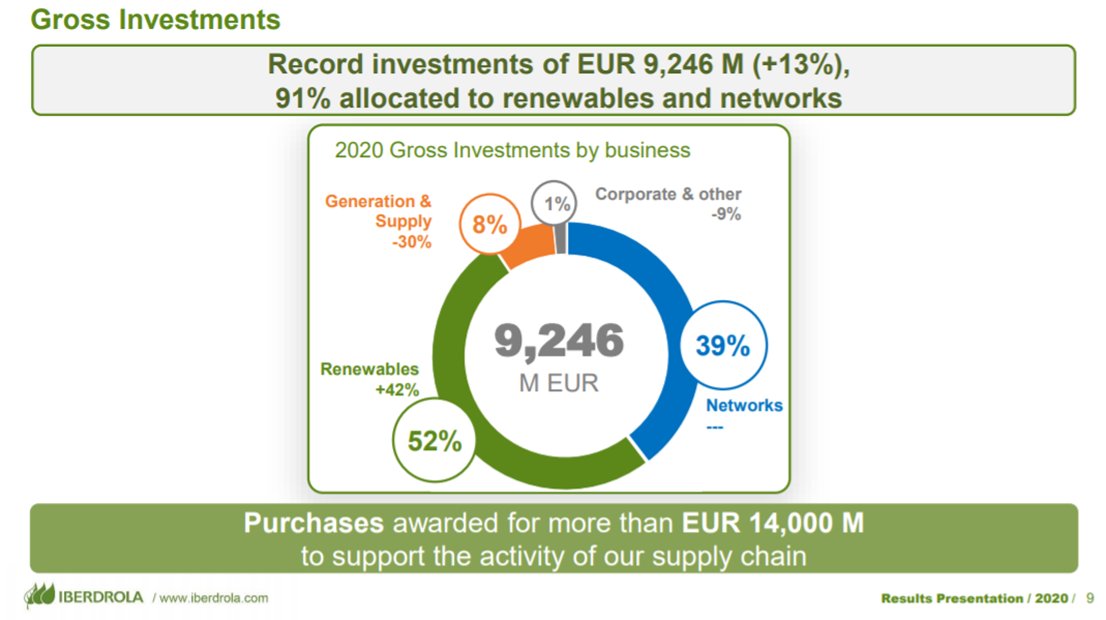
17. Example of Iberdrola $IBE.MC – They have massive CAPEX across their global operations, including in Latin America where they can get +12% ROE and are active in M&A including Infigen off the #ASX
18. Total shareholder return in the longrun is a function of Dividend Yield + EPS Growth, and EPS Growth is a function of ROE and WACC.
From the table below, you can see the problem with regulated utilities in Australia.
From the table below, you can see the problem with regulated utilities in Australia.

19. Catching a falling knife: I personally won’t invest in declining business because I reckon you can never get a margin of safety big enough, and there’s plenty of value traps.
reddit.com/r/ausstocks/co…
reddit.com/r/ausstocks/co…
20. DeLorean $DEL $DEL.AX: Special shout out for a new renewable bioenergy company that IPO’d in 2021. Assuming they can manage their capital allocation and not dilute shareholders, plenty of potential returns here:
https://twitter.com/DownunderValue/status/1400719355072040961
21. Absoloute Returns of 10%: With relatively low risk, you can get 9-10% in the US and potentially higher in Europe.
Three things to keep in mind.
First, exchange rates. A smarter person would add FX risk by looking at rate differentials (AUDUSD ~1.5%).
Three things to keep in mind.
First, exchange rates. A smarter person would add FX risk by looking at rate differentials (AUDUSD ~1.5%).
22. Second, Dividend vs Growth: The US is such a deep market you can have 2% DPS + 8% EPS Growth, or 3/7, or even 4/6. It’s a very efficient market across the 9-10% TSR range.
I like having a range in my portfolio, noting they're ~100% correlated bets.
I like having a range in my portfolio, noting they're ~100% correlated bets.
23. Rates, Bro? Risk of increasing rates is real.
This increases WACC; inflation reduces real revenue; and compresses the PE. If rates increase slowly, the impact is less than people think.
This increases WACC; inflation reduces real revenue; and compresses the PE. If rates increase slowly, the impact is less than people think.

24. Overall, this is one way to anchor a portfolio. It may not be sexy, but at least you’ll sleep well.
If you enjoyed this, bash the like / retweet / follow buttons.
Questions and feedback always welcome. DYOR.
Disclaimer, I’m long BEP, D, NEE, DEL.
If you enjoyed this, bash the like / retweet / follow buttons.
Questions and feedback always welcome. DYOR.
Disclaimer, I’m long BEP, D, NEE, DEL.
Well, turns out the least-bad option for electric utilities in Australia (Spark Infrastructure $SKI.AX $SKI) is about to cop a takeover bid.
.. The global hunt for infrastructure and fixed income asset continues to drive down yields, drive up prices, and drive up risk taking.
.. The global hunt for infrastructure and fixed income asset continues to drive down yields, drive up prices, and drive up risk taking.
• • •
Missing some Tweet in this thread? You can try to
force a refresh


