I think perhaps today I'll slant my regular look at Covid stats in the UK towards whats happened over the last 7 days, to give us a fuller view where we're going as we foolishly throw all caution to the wind. Here's the overall picture before a deep dive (1) Image
We've had 283 deaths over the last 7 days, up from 203. Thats a 40% rise in 7 days. (2) Image
The rate of rise has been more or less constant all week. Yes, its a lower base we're rising from, butwe continue to see deathsrising exponentially (3) Image
Yes, its an exponential rise. You can see it on a log plot. It ain't going up 1, 2, 3, 4. Its going up 1, 2, 4, 8. This is incredibly dangerous (4) Image
Sundays and Mondays are always lower reporting days, and we know from the first and second phases of the pandemic here when they report especially lowly that tends to the next days being very bad. Thats happening right now (5) Image
We're over 316,000 cases over the last 7 days now. 7 days ago it was 222,000 or thereabouts. Thats a 42.6% rise in 7 days. (6) Image
Cases are also rising exponentially. (7) Image
And they're rising ever faster right now (8) Image
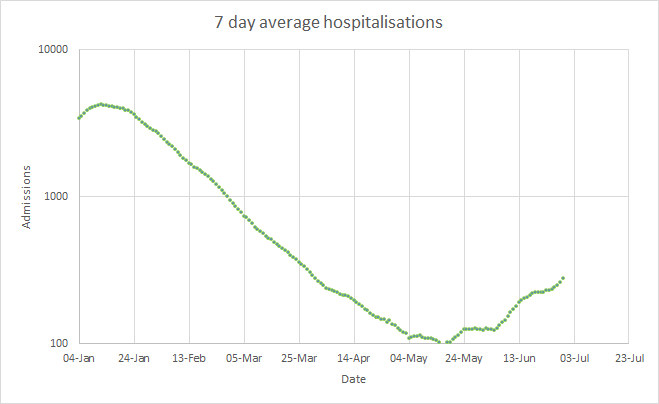
We have hospitalisation data to the 13th of July. That was a total of 740, the daily average up by, surprise surpsrise, about 40% (39.6% to be precise). We can't keep filling hospitals exponentially faster for long (9) Image
Using appropriate delays for each, we can see that R has continued trending more or less upwards. Infection rate is getting worse, not better. (10) Image
Curiously a higher proportion of the number recorded as infected are being admitted to hospital. That rose from 1.79% to 1.95% over 7 days (11) Image
The only good marker is that the percentage who are killed continues to trend slowly down. It reached 0.17%, the lowest it has been. (12) Image
So after another weeks data what can we conclude? Coming in to the farcically dubbed 'freedom day' we've got about 40% more infected, 40% more hospitalised and 40% more killed than the week before (13)
The rate vaccines are making things better has slowed right down, and the rate cases and deaths are increasing is currently MASSIVELY outstripping it. (14)
To the point where those improvements do not show up AT ALL in a broader look at the data. Things are getting worse, at an exponential rate (15) Image
Schools will be breaking up for summer. That will reduce the number of cases or at least slow the rise, but watch the proportion hospitalsied going forward. If we replace those kids with aduts, that'll rise faster (16)
And as sure as eggs is eggs when the proportion being hospitalised rises the proportion dying will rise (or stop falling) 12 days later. (17)
The disaster isn't coming. The disaster is here. Whatever happens tomorrow we've got another 23 days of deaths rising baked in now. It is inevitable. How bad will it get? Thats a discussion for another day. (fin)

• • •

Missing some Tweet in this thread? You can try to force a refresh
 

Keep Current with Cab Davidson #FBPE

Cab Davidson #FBPE Profile picture

Stay in touch and get notified when new unrolls are available from this author!

Read all threads

This Thread may be Removed Anytime!

PDF

Twitter may remove this content at anytime! Save it as PDF for later use!

Try unrolling a thread yourself!

how to unroll video
  1. Follow @ThreadReaderApp to mention us!

  2. From a Twitter thread mention us with a keyword "unroll"
@threadreaderapp unroll

Practice here first or read more on our help page!

More from @gnomeicide

20 Jul
Terrible Covid data in the UK today. 46558 cases and 93 deaths. Exponentials will bite you in the arse every single time. Here's the overall picture before delving deeper (1) Image
On exponential plots its fairly obvious whats going on. A straight line on a log plot means your're going up at an exponential rate. Cases and deaths are rising exponentially. (2) Image
93 deaths takes the 7 day total to 339. Its the highest single day total since the 24th of March, and the highest 7 day total since the 30th of March. And rising FAST. (3) Image
Read 18 tweets
6 Jul
Overall Covid scenario in the UK isn't looking good. Its not all bad, but we're hitting some desperately grim milestones right now. Here's the overall picture. Strap in. This is gong to take some working through (1)
Deaths and cases are rising exponentially, but not on the same exponent. There is no such thing as an exponential rise in either thats not terrible news though (2)
37 deaths today is the highest single day total since St. Georges day, and the 7 day rolling average is over 20 now for the first time since the 29th of April. An exponential rise means things get worse at a proportionally constant speed - 1,2,4,8,16,32... (3)
Read 24 tweets
5 Jul
I don't think positive tests will rise at the same rate today as we've seen previously, because last Monday we saw catch-up data missed on Sunday. On that trend we'd see 37625 to 38221 cases (1)
...but anything over 22868 is a rise. We could well go over 30k in a day for the first time. (2)
The monday lag means deaths should be low. 3-4 deaths would be on trend. Last Monday we saw 3 (3)
Read 5 tweets
5 Jul
The problem for the government with mask wearing is that they are dogmatically individualistic in themselves but innately prejudiced against others. They don't believe in collective responsibility among themselves, but the DO hold others collectively responsible...
...see for reference governments treatment of immigrants. So the idea that we each do something to ensure the safety of everyone? Thats anathema to the modern Tory ideology. There are no One Nation Conservaties now...
...person A does something good of persons B, C, D, E and F, thats clearly a good thing. Tory ideology is persons B, C, D and E are responsible to doge what Person A does, not the other way round...
Read 5 tweets
4 Jul
Just had another look at back calculating R (Covid infection rate) from hospitalisations as well as from deaths and recorded infections. I think I've got it now. Image
Hospitalisation requirements change, treatments change, testing regimens change with capacity and surge testing, I'm quite surprised the three calculations align as well as this Image
What does this tell us? Well, to line up R from hospital admissions we need to go eleven days back. That fits in well with the ONS data saying 6 days, especially for older folks, after showing symptoms (on average 5 days after infection). So peak hospitalisation is 11 days
Read 8 tweets
4 Jul
I won't post a full Covid stats thread today, but I'll go over roughly where we are. I'll start with cases. We've reached a staggering 173662 cases over the last 7 days. 24809 a day. Thats the highest since the 30th of January (1) Image
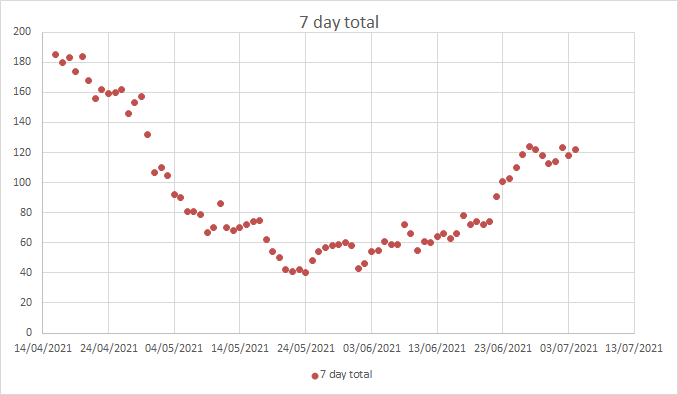
The most recent data we have for hospitalisations is from the 29th of June. Thats 358, the highest since the 23rd of March. Admissions are rising exponentially. (2) Image
We've had 122 Covid deaths over the last 7 days. The trend is, well, unimstakably upwards - you'd have to be very optimistic to look at rising cases and hospitalisations and maintain otherwise because of a spike in deaths a week ago (3) Image
Read 8 tweets

Did Thread Reader help you today?

Support us! We are indie developers!


This site is made by just two indie developers on a laptop doing marketing, support and development! Read more about the story.

Become a Premium Member ($3/month or $30/year) and get exclusive features!

Become Premium

Too expensive? Make a small donation by buying us coffee ($5) or help with server cost ($10)

Donate via Paypal Become our Patreon

Thank you for your support!

Follow Us on Twitter!

:(