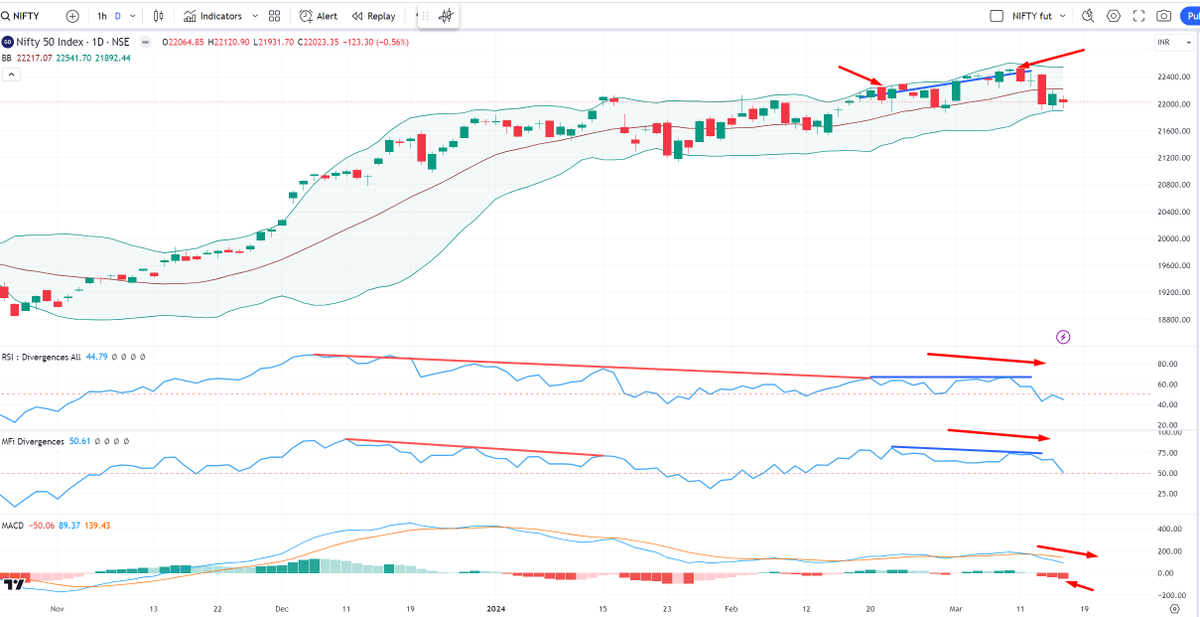
Markets are dynamic, so your analysis should also be dynamic ( change as new data comes in)
BNF now
see the MFI attempting upside breakout before price. So now if price breaks out , that will be a confirmation
I am ready now for an upside spike
Cross of 34720 should lead to a sharp upmove
( see the charts shared, you will understand this level)
anytime now
MFI gave a breakout, but no confirmation from price. 34720 was simply the last swing high. Whatever the indicators say, this is why price confirmation is necessary
Now MFI values too low to short ( despite trendline breakdown). MFI is now oversold.
So, no trade. we wait
The code being used ( if you are new to my timeline)
This is where TA is art. Normally, breakdown in both, so a sell. But MFI values were oversold, selling would have lead to trapped or getting stopped out
expectations..
this is what I am seeing
• • •
Missing some Tweet in this thread? You can try to
force a refresh
Will show Nifty and BankNifty charts, best if one sees on a laptop/computer screen to see the layout. Mobile apps seems to show only one chart. Change background to black to see the SL lines.
Options Analyser analyses the whole option chain and shows Bullish or Bearish. Deep blue bars hitting > 96 is strongly bullish. Deep red bars <-96 are strongly bearish.
Value above 68 bullish , below -68 bearish.
Values between -68 and 68 are neutral/congestion .
Buy or Sell signals gets generated based on AVWAPS, shows entry point and SL .
There is another signal shown and P_Buy or P_Sell. That's a pullback buy or pullback sell , generally much more accurate than a normal buy/sell
Nifty puts added OI from 22000-22000 which is normal as Nifty went up, so is the cut in the 22k ce OI.
What is abnormal is the cut in 22500pe, that should have added OI by the same logic.
So we now watch two strikes :
Nifty bullish if 22500pe trades below 310 and 22000pe trades below 80.
Nifty bearish if 22500pe trades above 392 and 22000pe trades above 150
On BNF , two strikes stand out. The addition on the 47k ce ( thrice that of 47k pe) and addition in ITM 46500ce.
So we will watch these two strikes
BN bullish if the 46500ce trades above 1175 and 47000ce trades above 870
BN bearish if 46500ce trades below 850 and 47000ce trades below 580.
What's very interesting is the OI behavior on the 46500ce , the sellers kept on selling even when BN went up without any fear.
Makes me say they know something which makes BN much more bearish than NIFTY
Last but not the least, my standard template on eod charts.
Make your own inferences, important to keep the broader picture in mind.
BankNifty had an almost 28% increase in COI today. This COI increase in a large range day ( up or down) would have been justifiable, not in a range day like today. The only logic can be the coming RBI MPC meet from which someone is expecting something very very big
So I went back for the last couple of years and tried to check how BN behaves after such and increase in COI
Then went through the bhavcopy to check which month has seen the increase ( will give an idea / confirmation about these players when they are expecting the event). It's Oct expiry, so this is a near term game
Thanks to everyone who enquired about my well being. For the last almost 2 months, suffering from probable long covid symptoms.
1. I am a type 2 diabetic. Sugar etc was always under control. Now sugars, cholesterol etc have all shot thru the roof. HBA1C at 9 , ACR is 130
2. Joint pains at shoulder , xray-usg-mri does not find any physical reasons
3. Huge fatigue. Getting out of bed or going out is a chore.
4. Problems with short term memory. I am forgetting certain things , have been pointed this out by my near family members, I did not realise this myself. This is actually pretty scary.
5. Abcesses/styes out of nowhere ( one was solved by a twitter doc friend)