
This will contain a list of the times you have downplayed Covid. Not actually denied it, but misrepresented the facts to imply it's less serious than it is:
1/n
1/n
https://twitter.com/JamesMelville/status/1421829202223980555
https://twitter.com/JamesMelville/status/1420648091053604866?s=20
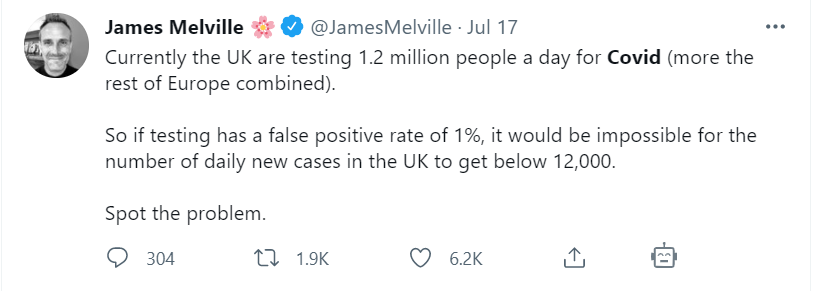
Except that the false positive rate is far below 0.1%
Australia had literally 100s of ks of consecutive negative test results with no positives except in quarantine. UK can't be higher than min in this chart if all asymptomatic were false. They weren't

3/n
This was untrue so again downplaying Covid
fullfact.org/online/james-m…
https://twitter.com/JamesMelville/status/1416795247577812992?s=20
This was untrue so again downplaying Covid
fullfact.org/online/james-m…
4/n
heartless and ignoring multiple cases of reinfection with Delta
https://twitter.com/JamesMelville/status/1417881202581774338?s=20
heartless and ignoring multiple cases of reinfection with Delta

5/n
Not exactly downplaying Covid, but utterly misunderstanding the numbers given Israel's fairly low Covid infection rate and high vaccination rate.
https://twitter.com/JamesMelville/status/1417857847484891144?s=20
Not exactly downplaying Covid, but utterly misunderstanding the numbers given Israel's fairly low Covid infection rate and high vaccination rate.
https://twitter.com/JamesMelville/status/1417857847484891144?s=20
6/n again misunderstanding that the false positivity rate is at worst in the tens of ppm level
https://twitter.com/JamesMelville/status/1416277192737280000?s=20
7/n
No facts but again implying that protections against Covid are needless. So again downplaying Covid
https://twitter.com/JamesMelville/status/1416024399728324614?s=20
No facts but again implying that protections against Covid are needless. So again downplaying Covid
8/n
Again this implies that Covid isn't a problem - because otherwise why would you not want hospitals to test for it, when the most vulnerable would be exposed
https://twitter.com/JamesMelville/status/1415543490642067457?s=20
Again this implies that Covid isn't a problem - because otherwise why would you not want hospitals to test for it, when the most vulnerable would be exposed
9/n
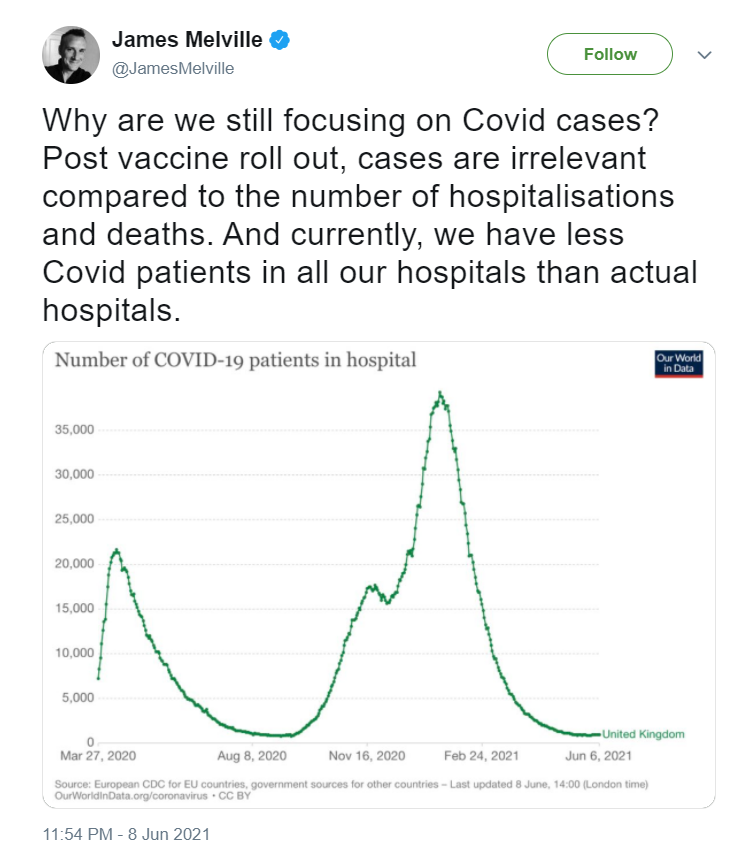
Again downplaying the pandemic, and ignoring the exponential growth in hospitalisations tripling in 4 weeks and with healthcare numbers similar to October 2020
https://twitter.com/JamesMelville/status/1415429467074441217?s=20
Again downplaying the pandemic, and ignoring the exponential growth in hospitalisations tripling in 4 weeks and with healthcare numbers similar to October 2020

10/n
Again this isn't true. Generally Covid is less severe for those who are younger, but long covid kids are a concern to actual experts. People who don't keep asserting things without checking.
nature.com/articles/d4158…
https://twitter.com/JamesMelville/status/1411454155307335690?s=20
Again this isn't true. Generally Covid is less severe for those who are younger, but long covid kids are a concern to actual experts. People who don't keep asserting things without checking.
nature.com/articles/d4158…
11/n Now I am blocked and only manged to get to the end of the month. I limited myself to facts.
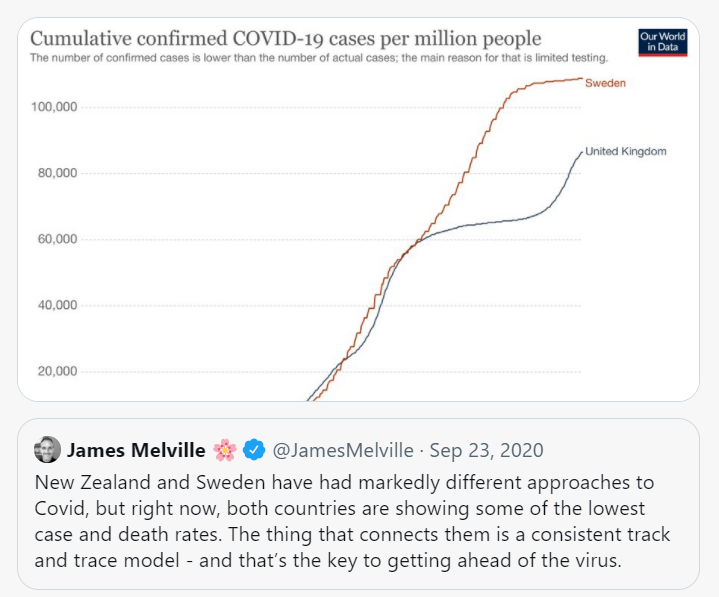
Still there is this that I have been sent which was way out of date at the time, and partly due to Sweden's way of reporting deaths
Still there is this that I have been sent which was way out of date at the time, and partly due to Sweden's way of reporting deaths

12/n
Again, technically true, but misleading as even at the time we were seeing hospitalisations growing
https://twitter.com/JamesMelville/status/1407630013315403776?s=20
Again, technically true, but misleading as even at the time we were seeing hospitalisations growing

screenshot - I had hoped Melville was big enough to defend his record rather than run away. Maybe he thought he had a point to defend?


Screenshot: 6/n
Screenshot 7/n

screenshot 8/n

Screenshot 9/n

Screenshot 10/n

Screenshot 10/n

13/n
This is implying that public health advertising in a pandemic is presumably pointless, so again downplaying the need for basic information
https://twitter.com/JamesMelville/status/1420645661670879233?s=20
This is implying that public health advertising in a pandemic is presumably pointless, so again downplaying the need for basic information

screenshot for context:

14/n Again - when cases and even hospitalisations had already started to rise.
https://twitter.com/JamesMelville/status/1406255594181480450?s=20

15/n
The same mistake as before downplaying the severity but at the start of the second wave
https://twitter.com/JamesMelville/status/1301284639873662981
The same mistake as before downplaying the severity but at the start of the second wave

16/n
Covid is responsible for this too
https://twitter.com/JamesMelville/status/1405937485193023499?s=20
Covid is responsible for this too

17/n
Again, not straight denial of Covid, but wishful thinking at best. And attacking Boris Johnson's government for being too cautious. Which is a bit of a flex.
https://twitter.com/JamesMelville/status/1405874659359440900?s=20
Again, not straight denial of Covid, but wishful thinking at best. And attacking Boris Johnson's government for being too cautious. Which is a bit of a flex.

18/n
Again not denying Covid, simply advocating ignoring the restrictions which were there for a good reason
https://twitter.com/JamesMelville/status/1405779188339003398?s=20
Again not denying Covid, simply advocating ignoring the restrictions which were there for a good reason

19/n
Again playing at being an epidemiologist, and a bad one at that.
https://twitter.com/JamesMelville/status/1308804074490531842
Again playing at being an epidemiologist, and a bad one at that.
20/n
This was deleted
This was deleted
Screenshot for context - hope this time it stays at the top

21/n
Now this looks pretty much like downplaying the virus and the new variants to me
Now this looks pretty much like downplaying the virus and the new variants to me
https://twitter.com/JamesMelville/status/1402346542955216898

• • •
Missing some Tweet in this thread? You can try to
force a refresh


