
8/3 Texas C19 Pos%, Case, Hosp & Fatality update:
THREAD:
Highlights:
1) Antigen confirmed peak, PCR possibly in peak
2) Cases Gone Wild
3) Hosps continue behind 2020
4) Weekly update to Fatality Projection model - downward revision
5) 51 reported fatalities today
1/n
.
THREAD:
Highlights:
1) Antigen confirmed peak, PCR possibly in peak
2) Cases Gone Wild
3) Hosps continue behind 2020
4) Weekly update to Fatality Projection model - downward revision
5) 51 reported fatalities today
1/n
.
https://twitter.com/therealarod1984/status/1422249440283398148
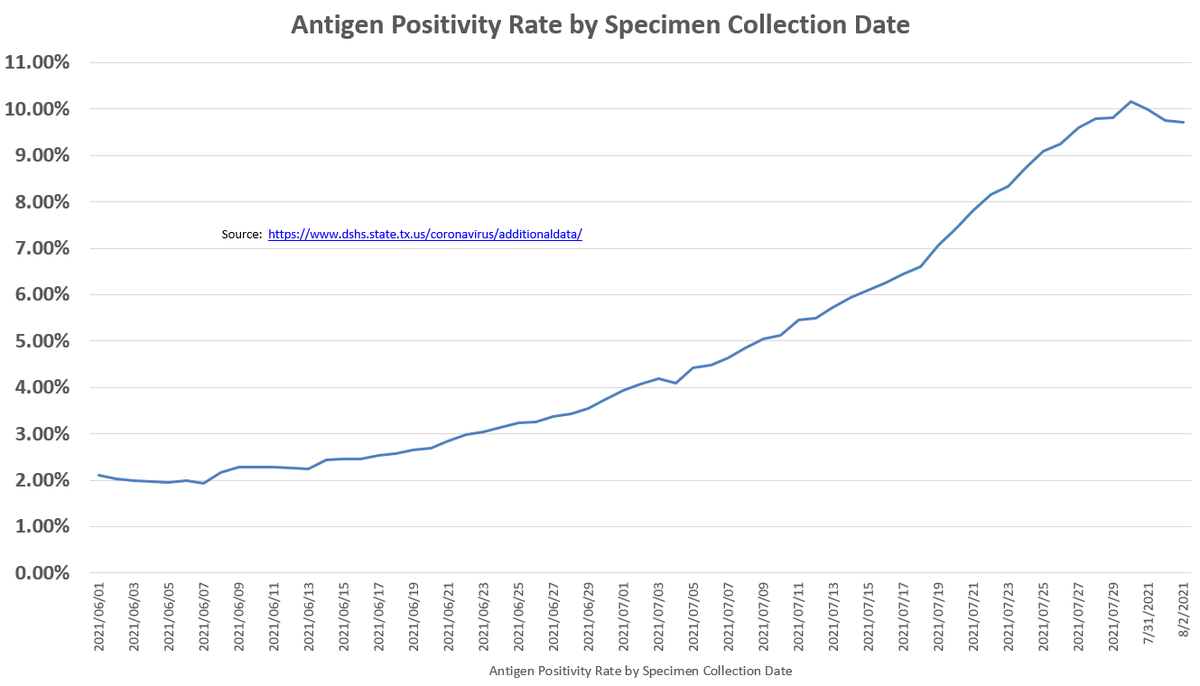
8/3 Positivity Rate:
* I'm 90% sure Antigen Pos% has peaked. New revisions today, but 3 days of declines since Friday peak.
* PCR revisions show new slight climb today, but the past 6 days have been within 1% of each other, with a peak clearly forming. We watch.
2/n
.
* I'm 90% sure Antigen Pos% has peaked. New revisions today, but 3 days of declines since Friday peak.
* PCR revisions show new slight climb today, but the past 6 days have been within 1% of each other, with a peak clearly forming. We watch.
2/n
.

8/3 Case:
Another day over 10K cases. Cases are going nuts, way ahead of 2020 pace. But its #Casedemic as you will see in the next few slides.
Cases at nearly 8500/day in the 7DMA, not far from Summer 2020 peak of 10250. Vaccines where art thou?
Hang in there.
3/n
Another day over 10K cases. Cases are going nuts, way ahead of 2020 pace. But its #Casedemic as you will see in the next few slides.
Cases at nearly 8500/day in the 7DMA, not far from Summer 2020 peak of 10250. Vaccines where art thou?
Hang in there.
3/n


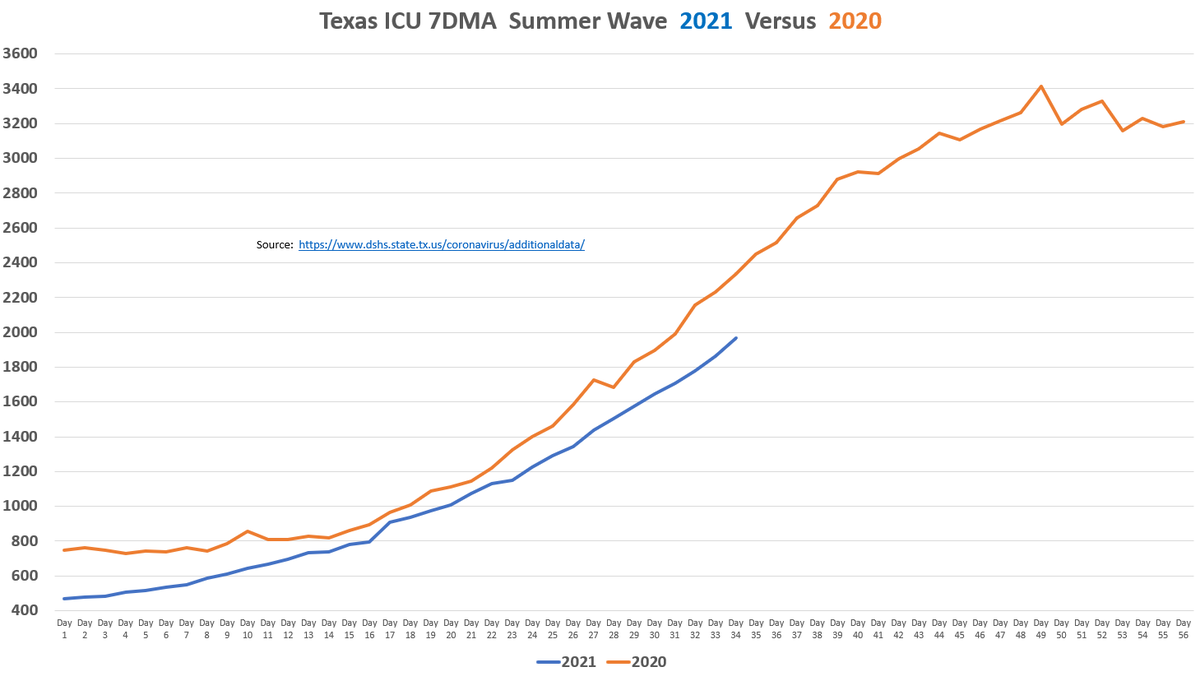
8/3 Hospitalizations
* Patients tagged as C19 still only 11% of total beds in the state
* Gen Beds now 4% behind Summer 2020 pace, ICU beds 16% behind
* Way more cases, but fewer in hospital, & significantly fewer in ICU
* Peaks of 9500 & 17% total beds are still my guess
4/n
* Patients tagged as C19 still only 11% of total beds in the state
* Gen Beds now 4% behind Summer 2020 pace, ICU beds 16% behind
* Way more cases, but fewer in hospital, & significantly fewer in ICU
* Peaks of 9500 & 17% total beds are still my guess
4/n


8/3 Fatalities Part 1: Revised Projections
Revised 15 previous projections for 7/5-7/19 (Dates at top of image). Revised 11 down (Green), 3 same (Yellow), & 1 up (Red). On the previous projections for 6/20-7/4, 12 actuals under (green) and 2 came in on the nose (yellow).
5/n
Revised 15 previous projections for 7/5-7/19 (Dates at top of image). Revised 11 down (Green), 3 same (Yellow), & 1 up (Red). On the previous projections for 6/20-7/4, 12 actuals under (green) and 2 came in on the nose (yellow).
5/n

8/3 Fatality Projection Part 2:
Also projected 7/20 - 7/26. Looks ugly, but if the recent past is an indication, I will be revising down next week (so far averaging 22% downward revision per week). The projected fatality chart reflects these new projected numbers.
6/n
.
Also projected 7/20 - 7/26. Looks ugly, but if the recent past is an indication, I will be revising down next week (so far averaging 22% downward revision per week). The projected fatality chart reflects these new projected numbers.
6/n
.


8/3 Fatalities Part 3 - vs. 2020
Since we have 2 Summer waves 13 months to the day, I can compare 2020 actuals from 5/20/20 vs. 2021 revised projected & 2021 actuals from 6/20/21.
So far through day 23 of the waves, 2021 projected is down 17% vs 2021 Actual.
7/n
.
Since we have 2 Summer waves 13 months to the day, I can compare 2020 actuals from 5/20/20 vs. 2021 revised projected & 2021 actuals from 6/20/21.
So far through day 23 of the waves, 2021 projected is down 17% vs 2021 Actual.
7/n
.


8/3 - Fatalities Part 4 - Reported Fatalities and Actual Fatalities vs. Hospitalizations chart
* 51 reported fatalities. They're starting to increase as expected
* As mentioned before arrivals are quicker than anticipated, which is precipitating all the downward revision
8/n
.
* 51 reported fatalities. They're starting to increase as expected
* As mentioned before arrivals are quicker than anticipated, which is precipitating all the downward revision
8/n
.


8/3 - Conclusion
Same story. More cases, less hosps & fatalities vs 2020 wave. Well know tomorrow if Antigen pos% is 100% post-peak, & what the story is on PCR, which appears in-peak.
45 days is 8/14, that might also be the magic number for Texas Case peak. Hang on!
9/end
Same story. More cases, less hosps & fatalities vs 2020 wave. Well know tomorrow if Antigen pos% is 100% post-peak, & what the story is on PCR, which appears in-peak.
45 days is 8/14, that might also be the magic number for Texas Case peak. Hang on!
9/end
@kylenabecker @kylamb8 @justin_hart @kerpen @jhaskinscabrera @AlexBerenson @guypbenson @benshapiro @MZHemingway @JordanSchachtel
Sorry, the chart in 8/n has the right data, but the wrong title. Here is the corrected chart with the right title. Its the actuals. See 6/n for the projected chart.

• • •
Missing some Tweet in this thread? You can try to
force a refresh


