The push for vaccine passports and talk of a fourth wave caused by the unvaccinated does not reflect confidence in the vaccines, but rather the complete opposite. This is driven by the realization that the vaccines are not a covid-eliminating silver bullet.
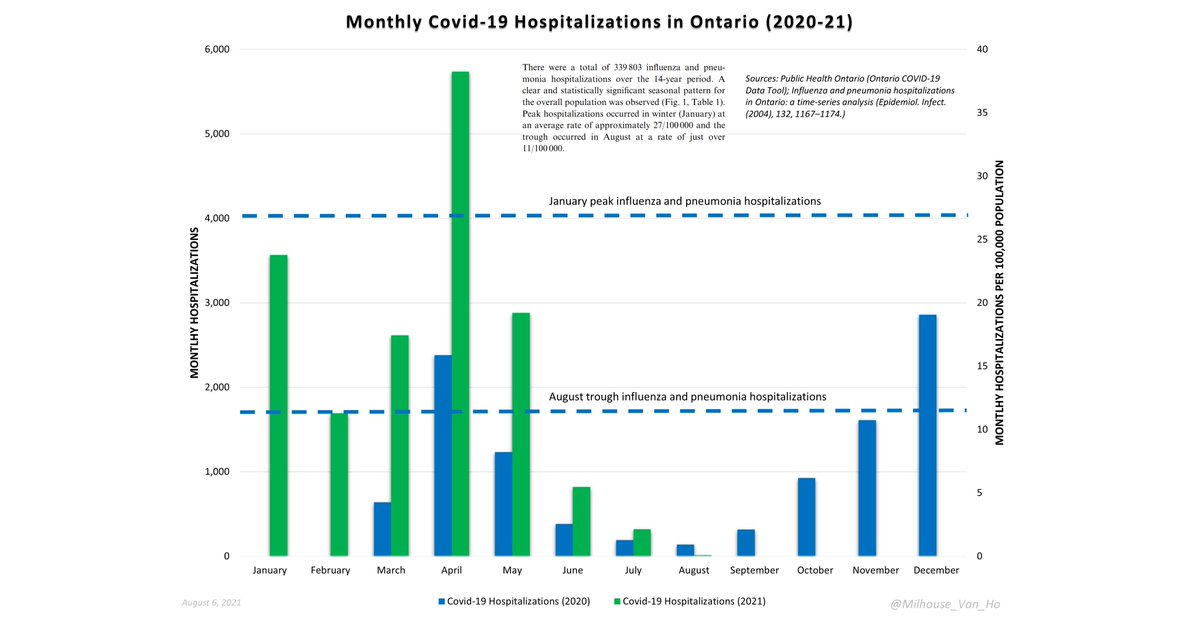
Cases, hospitalizations, and deaths will inevitably increase again in the fall and decline next spring. We see this every single year with influenza and other respiratory viruses.
The unvaccinated narrative simply deflects blame to individuals. This is tribalism at its worst.
The unvaccinated narrative simply deflects blame to individuals. This is tribalism at its worst.
The vaccines may very well be effective at reducing the severity of symptoms, particularly in the elderly and frail, and that is great news. However, we'll still need to live with covid the way we've always lived with influenza. Coercion and segregation isn't helping anyone.
We need to accept that even 100% vaccination wouldn't eliminate covid.
Despite all her previous mistakes, @CMOH_Alberta is correct now. We need to move on and quit our myopic focus on a single ailment.
Our unproductive response to covid is worse than covid itself.
Despite all her previous mistakes, @CMOH_Alberta is correct now. We need to move on and quit our myopic focus on a single ailment.
Our unproductive response to covid is worse than covid itself.
• • •
Missing some Tweet in this thread? You can try to
force a refresh