
A detailed guide on #TX3 by @EdelweissFin
Software worth 50,000/- for F R E E 🏆
Scroll down 👇 for detailed analysis
(Using for 2+years)
User guide PDF 📙 edelweiss.in/ewwebimages/We…
#chartians #momentum #StockMarketindia #trading #tx3 #edelweiss
Software worth 50,000/- for F R E E 🏆
Scroll down 👇 for detailed analysis
(Using for 2+years)
User guide PDF 📙 edelweiss.in/ewwebimages/We…
#chartians #momentum #StockMarketindia #trading #tx3 #edelweiss

@CAPratik_INDIAN @_GauravVashisth @stockifi_Invest @TSG_Capital @VRtrendfollower @krishnblue @jitendrajain @SANAMBHATIA99 @ca_mehtaravi @chartmojo @jigspatel1988 @Rishikesh_ADX
Share for wider reach, so that people don't spend on costly softwares like Falcon/Spider 🙏
Share for wider reach, so that people don't spend on costly softwares like Falcon/Spider 🙏
1️⃣ TERMINAL LOOK
This is how the terminal looks like when you open it. You might be confused but we're here to help you out.
This is how the terminal looks like when you open it. You might be confused but we're here to help you out.

2️⃣ DEVICE WATCHLISTS
The terminal has 3 underlying watchlists.
(FnO/Nifty50)
Rest you can add as per your wish
The terminal has 3 underlying watchlists.
(FnO/Nifty50)
Rest you can add as per your wish

3️⃣ PREDEFINED WATCHLISTS
Here we can find each and every sector watchlists. When you click on them you'll get the stocks that are in that particular sector.
Can be helpful for sectoral Analysis.
Here we can find each and every sector watchlists. When you click on them you'll get the stocks that are in that particular sector.
Can be helpful for sectoral Analysis.

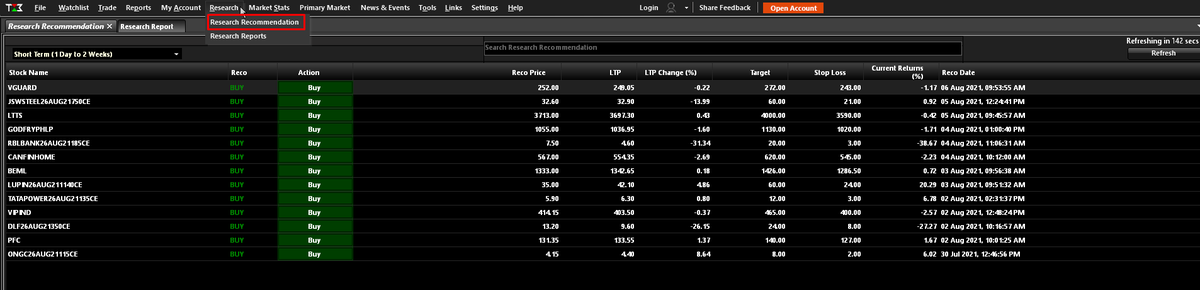
4️⃣ RESEARCH RECCOMENDADTION
Here @EdelweissFin provides stocks and good scripts for trading and investment.
Reccomendadtions vary from
- Options
- Cash stocks
- Future stocks
Here @EdelweissFin provides stocks and good scripts for trading and investment.
Reccomendadtions vary from
- Options
- Cash stocks
- Future stocks

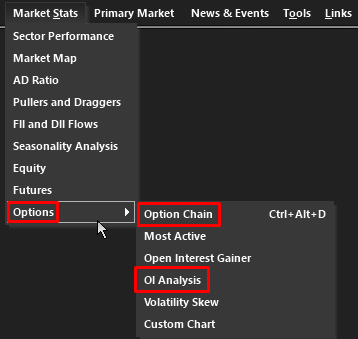
5️⃣ MARKET STATUS TOOLS
- Equity
- FnO
- Options
Get a detailed analysis on it right from
- Volume buzzers
- Options chain
- OI Analysis
- Volatility Skew
- Equity
- FnO
- Options
Get a detailed analysis on it right from
- Volume buzzers
- Options chain
- OI Analysis
- Volatility Skew


6️⃣ MARKET BREADTH
- Pullers and Draggers
- FII/DII Flow
- Sectoral Analysis
These tools can help you gauge the sentiment of the Market.
- Pullers and Draggers
- FII/DII Flow
- Sectoral Analysis
These tools can help you gauge the sentiment of the Market.


7️⃣ ADVANCE CHARTING

• • •
Missing some Tweet in this thread? You can try to
force a refresh


