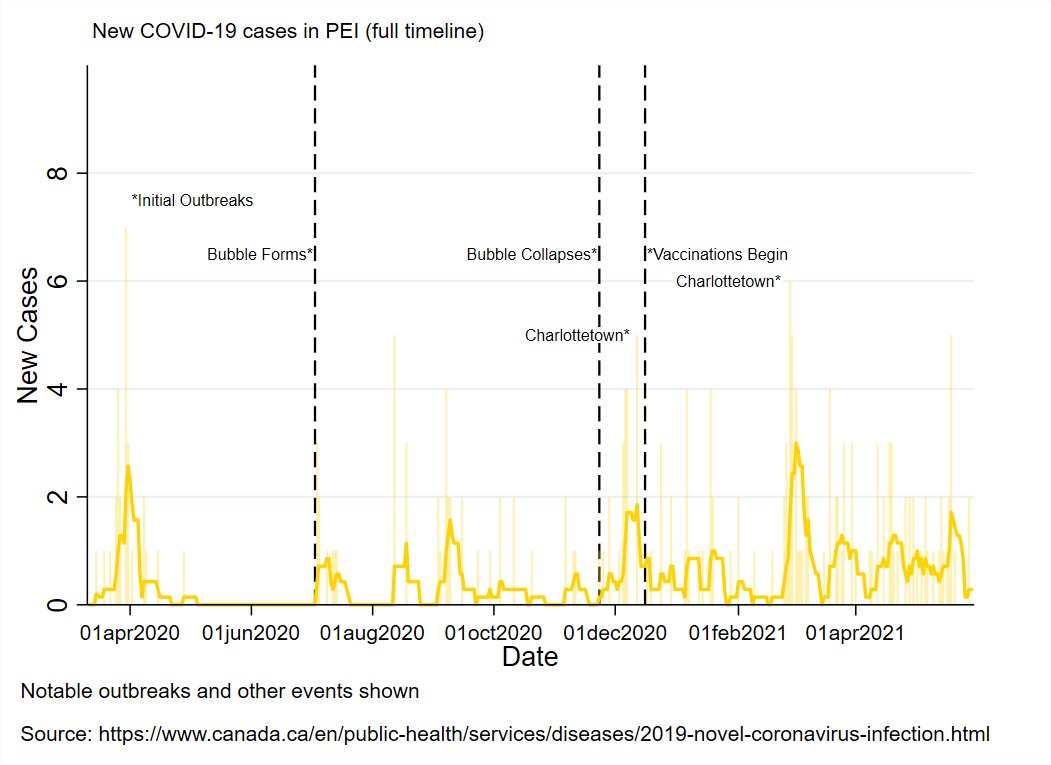
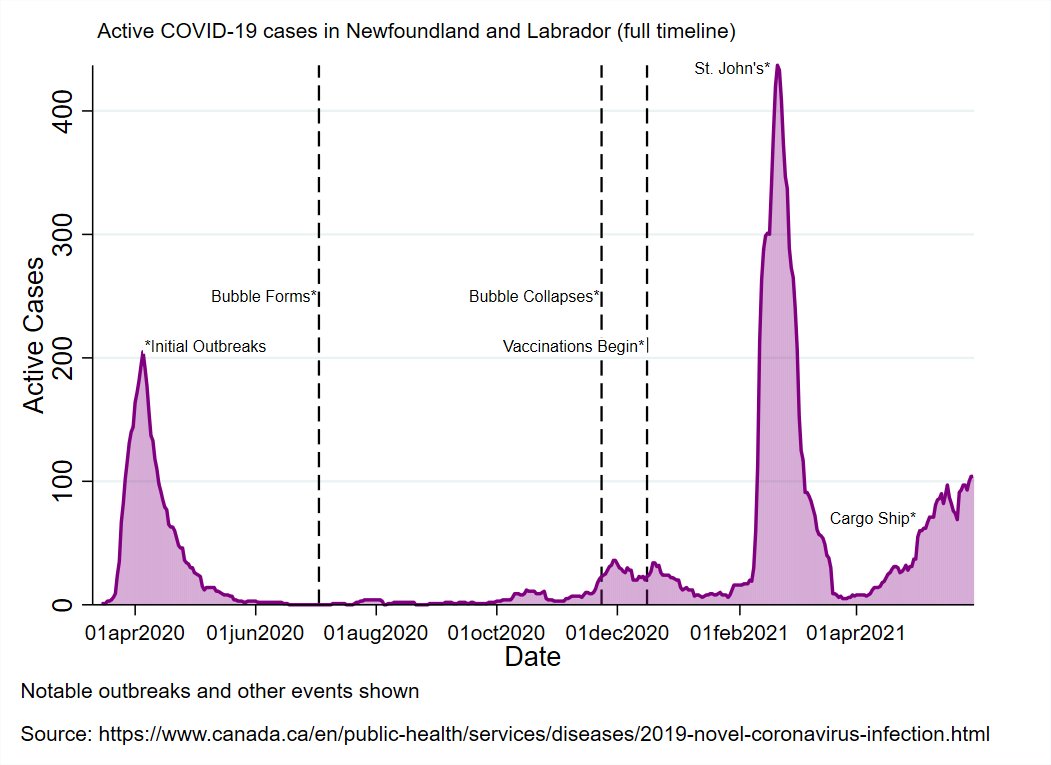
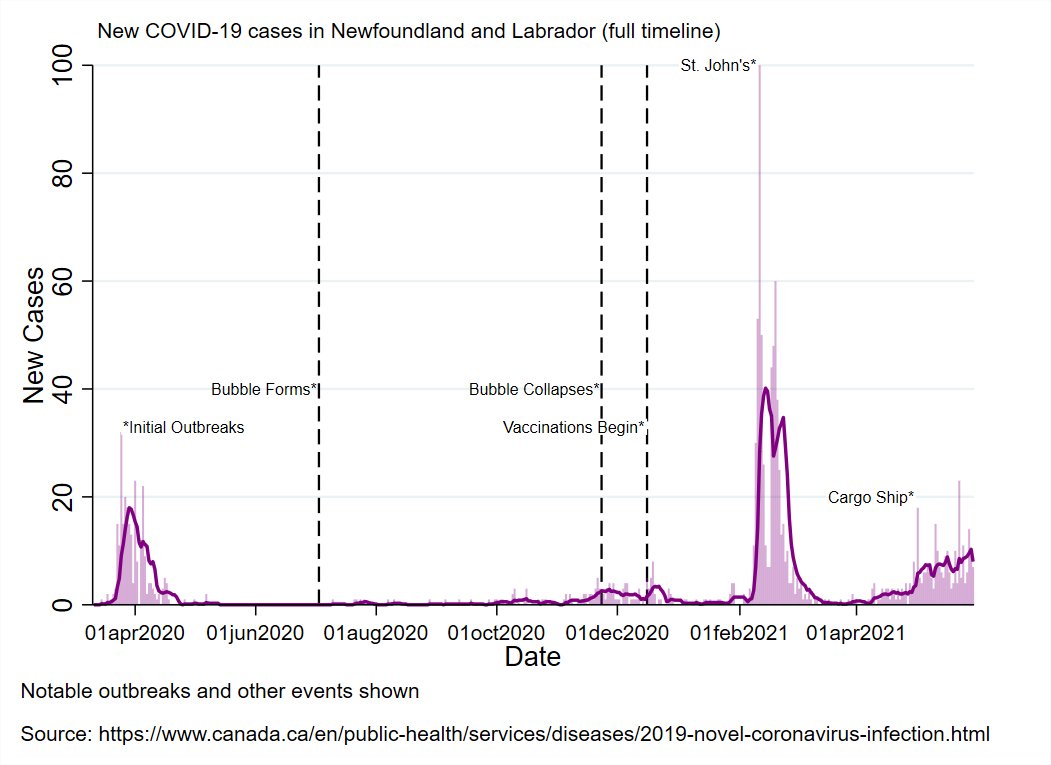
Today in the #AtlanticBubble
18* new cases were reported
11 in New Brunswick: 2 in Saint John (travel), 9 in Moncton (3 close contacts, 6 under investigation)
7* in Nova Scotia: 1 each in Western (travel) and Eastern (contact), and 5 in Halifax (all travel, 3 old/unreported)


18* new cases were reported
11 in New Brunswick: 2 in Saint John (travel), 9 in Moncton (3 close contacts, 6 under investigation)
7* in Nova Scotia: 1 each in Western (travel) and Eastern (contact), and 5 in Halifax (all travel, 3 old/unreported)


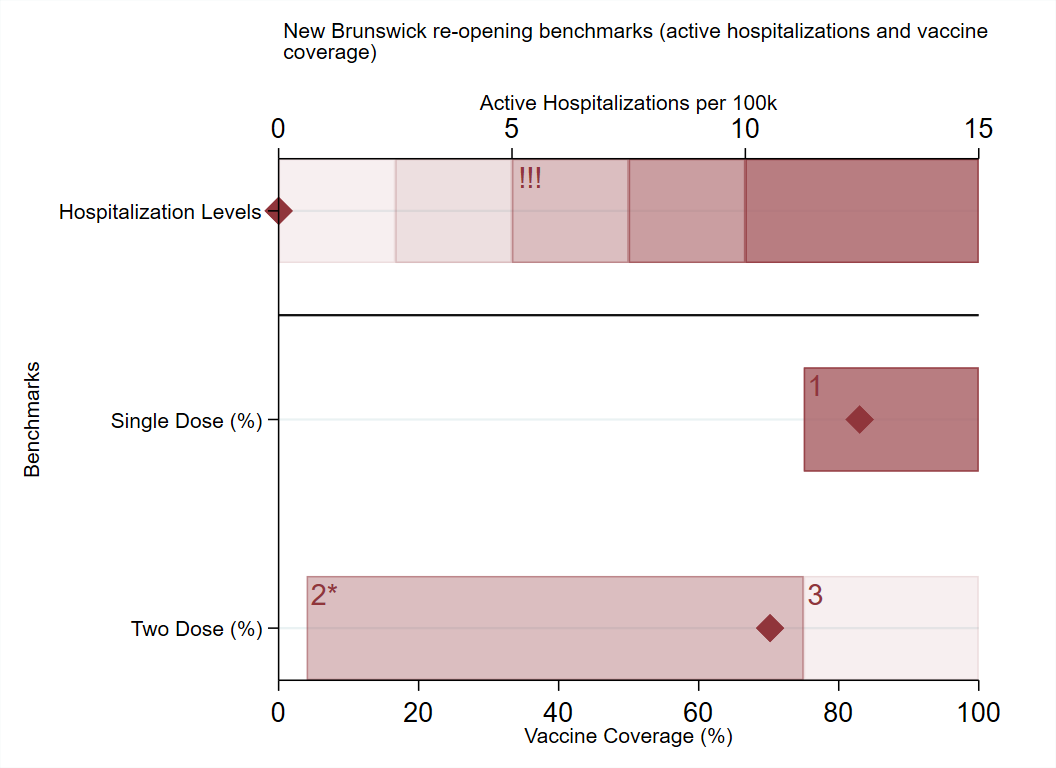
Regional Summary
Remains quiet save for the outbreak in the Moncton area.
Things still getting worse in Maine.
Remains quiet save for the outbreak in the Moncton area.
Things still getting worse in Maine.

Zoom in on NB:
1st graph is case timeline for NB
2nd is cases per capita for all health regions with Moncton emphasized.
3rd is hospitalizations
4th is deaths


1st graph is case timeline for NB
2nd is cases per capita for all health regions with Moncton emphasized.
3rd is hospitalizations
4th is deaths


Vaccine Roll-Out Metrics:
1st graph shows how many days since each province had enough doses to cover current usage.
Graphs 2-4 show vaccination speed: percent of the population age 12+ receiving 1st dose (graph 2), 2nd dose (graph 3), or either (total output, graph 4) daily.


1st graph shows how many days since each province had enough doses to cover current usage.
Graphs 2-4 show vaccination speed: percent of the population age 12+ receiving 1st dose (graph 2), 2nd dose (graph 3), or either (total output, graph 4) daily.


• • •
Missing some Tweet in this thread? You can try to
force a refresh


