ted Profile picture
Aug 17, 2021 6 tweets 4 min read Read on X
1/

Options market analysis on #BTC headed into the August month-end expiry!

Gamma Exposure...

#BTC sees positive gamma concentrated between $44k and $50k, with $50k being the high gamma strike.

This tells me that $44k should be the floor and price gravitates toward $50k!
2/

I often look for any spike higher in 'volatility skew' to gauge whether or not the market is in demand for downside protection - put buying as a hedge for #BTC long exposure

7-day skew has spiked and perhaps suggests some short-term demand for downside protection
3/

'Implied volatility term structure' suggests that there is no real panic and demand for volatility related products - which is in my opinion, very positive for #BTC bulls

Considering that Bitcoin is at key HTF resistance, the lack of demand for volatility is quite impressive
4/

While on the subject of volatility, implied volatility has trended lower since the crash of mid-May, leaving the market in a 'range-bound' environment for the most part ever since

Only recently has this metric started to move higher and suggests that larger moves are to come
5/

Just touching back on the subject of 'gamma exposure'...

As you can see above $44k, #BTC is in a comparatively high, positive GEX environment.

This environment often sees choppy, liquidity hunting price-action where breakout plays are quickly faded back into the range
6/

Summing this brief analysis up...

Over the short-term, the market appears worried about a little bit of downside in #BTC - indicated by a spike in vol. skew...

However, price should be supported at $44k and high GEX at $50k suggests that a move toward that level is likely

• • •

Missing some Tweet in this thread? You can try to force a refresh
 

Keep Current with ted

ted Profile picture

Stay in touch and get notified when new unrolls are available from this author!

Read all threads

This Thread may be Removed Anytime!

PDF

Twitter may remove this content at anytime! Save it as PDF for later use!

Try unrolling a thread yourself!

how to unroll video
  1. Follow @ThreadReaderApp to mention us!

  2. From a Twitter thread mention us with a keyword "unroll"
@threadreaderapp unroll

Practice here first or read more on our help page!

More from @tedtalksmacro

Jun 16, 2024
1/ Critical Week Ahead for Bitcoin: Disinflation Continues

Implied weekly ranges:
BTC - $65.1k - $74.1k USD
ETH - $3,388 - $4,025 USD

Thanks to @_WOO_X for supporting this content.

Here's what I am watching this week 👇Image
2/ Last week, both CPI + PPI data were optimistic for risk assets, with each showing that the disinflationary trend remains.

However, the Fed's message cautioned that the market shouldn't become overly enthusiastic about pricing in rate cuts in the near term.

This week is crucial for maintaining BTC's (and by extension) the broader crypto market's short-term trend.Image
3/ Bulls are keen to see ongoing signs of disinflation to feel confident that the Fed will ease from its current restrictive stance, thereby encouraging traders to venture out on the risk curve - and to invest in assets like cryptocurrencies

Well, that's what they got last week!
Read 10 tweets
Jun 11, 2024
1/ Week Size = Huge: June FOMC + US Inflation Data to Move Markets

Implied weekly ranges:
BTC - $64.9k - $74.3k USD
ETH - $3,399 - $4,014 USD

Thanks to @_WOO_X for supporting this content.

Here's what I am watching this week 👇Image
2/ Last week’s 'strong' employment data dampened crypto + stock bull's hopes for an imminent rate cut.

The market now almost completely pricing out a July rate cut by the Fed, with the probability of a cut lower by ~10% when compared with this time last week. Image
3/ Bitcoin + other cryptocurrencies have borne the brunt of this decreased appetite for risk so far this week.

For the first time in a month, outflows were recorded from spot BTC ETFs - likely owed to Friday's jobs report, along with fears of US inflation data + FOMC this week. Image
Read 11 tweets
Jun 3, 2024
1/ Inflation Continues to Slow, Employment Up Next! This week's outlook.

Implied weekly ranges:
BTC - $63.3k - $72.2k USD.
ETH - $3440 - $4110 USD.

Thanks to @_WOO_X for supporting this content - who are growing rapidly for all of the right reasons.

Full outlook 👇Image
2/ Last week, PCE data held the market at bay - with traders + investors eagerly anticipating the Fed's 'preferred' inflation measure.

Core printed 2.7% YoY, and headline 2.8%.

Although this is still slightly higher than the Fed's target of 2%, inflation is clearly trending in the right direction!

And the trend is very much our friend in this case.Image
Image
3/ The lack of market response to PCE data on Friday, was likely owed to numbers coming in-line and not 'surprising' traders...

But this data is optimistic for risk asset bulls longer term, as this continues to suggest that the next move for central banks is to ease.
Read 12 tweets
May 1, 2023
1/ Wednesday sees the Fed deliver their policy update for May.

Expectations are for this to be the final 25bps hike for this tightening cycle, so will it?

And what about QT and rate cuts later this year?

Let's investigate 👇 Image
2/ The Fed have led this tightening cycle (along with the RBNZ) by hiking +475bps in just over 12 months.

Tightening is approaching it's final stages as we reach the Fed's terminal rate communicated that was communicated to the market back in March. Image
3/ A 25bps hike would put us right where the majority of FOMC participants see the terminal rate for this cycle --> 500-525bps.

So based on Fed forward guidance, this hike should be the last.

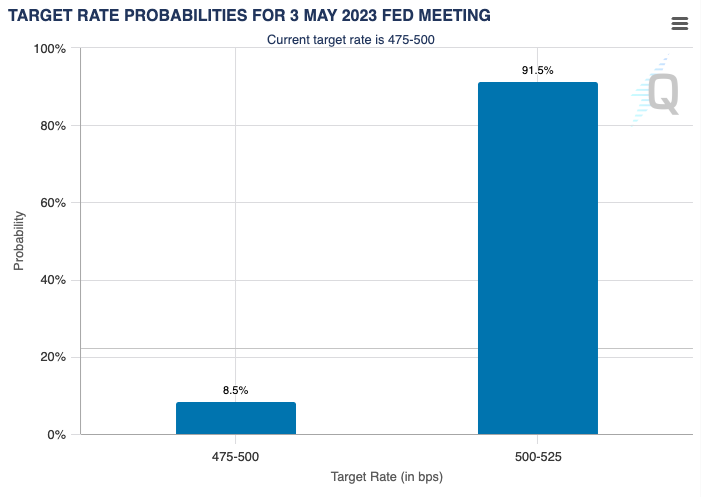
The market gives a 92% probability that the Fed hike by 25bps on Wednesday. ImageImage
Read 14 tweets
May 1, 2023
1/ A thread discussing the US dollar.

- Drivers of DXY in 2023 (up, down or sideways)
- DXY correlations / why the USD matters.

Let's go👇
2/ Firstly, let's understand how the DXY is measured and then take a look generally, at what makes currencies move.

DXY is a measure of the dollar's performance against a basket of other fiat currencies. Narratives/news specific to a non-dollar currency, will also move the DXY. Image
3/ The Euro makes up ~58% of the basket, and thus moves the DXY with most power.

What the Euro does, the DXY will do the opposite. So it pays to track what's going on in Europe, not just the US, to understand where the DXY is headed!

Other notable weights:
JPY - 14%
GBP - 12%
Read 12 tweets
Apr 25, 2023
1/ While most data is lagging, what tends to lead price is monetary + fiscal liquidity...

Let's quickly investigate whether liquidity has peaked or if new highs are to come👇 Image
2/ The recent surge in global liquidity has been owed to:

- US debt ceiling situation --> Treasury drawing down on their cash reserves,
- Banking crisis --> Fed balance sheet expansion to backstop failing banks,
- China restarting their economy post-COVID --> stimulate with $$ Image
3/ Tracking liquidity would've kept you on the right side of the risk asset reversals + trend so far this year.

Net USD liquidity is now greater than when the Fed commenced QT in April 2022! However, over the coming months, the US debt ceiling situation could quickly change that Image
Read 14 tweets

Did Thread Reader help you today?

Support us! We are indie developers!


This site is made by just two indie developers on a laptop doing marketing, support and development! Read more about the story.

Become a Premium Member ($3/month or $30/year) and get exclusive features!

Become Premium

Don't want to be a Premium member but still want to support us?

Make a small donation by buying us coffee ($5) or help with server cost ($10)

Donate via Paypal

Or Donate anonymously using crypto!

Ethereum

0xfe58350B80634f60Fa6Dc149a72b4DFbc17D341E copy

Bitcoin

3ATGMxNzCUFzxpMCHL5sWSt4DVtS8UqXpi copy

Thank you for your support!

Follow Us!

:(