Joeri Rogelj Profile picture
Aug 18, 2021 12 tweets 5 min read Read on X
After the first bang of the @IPCC_CH AR6 report, it's time to look at my favorite part of the report:
visuals in the SPM.

It was a privilege to work with a team of #dataviz and information design experts @angelamorelli @tomhal99 @jordanharold on these visuals
(1/n)
The first visual shows us that human influence has warmed the climate at a rate unprecedented in at least 2000 years.

I really like how it contrasts the climate our societies were used to during their development with the evidence that we are responsible.
(2/n)
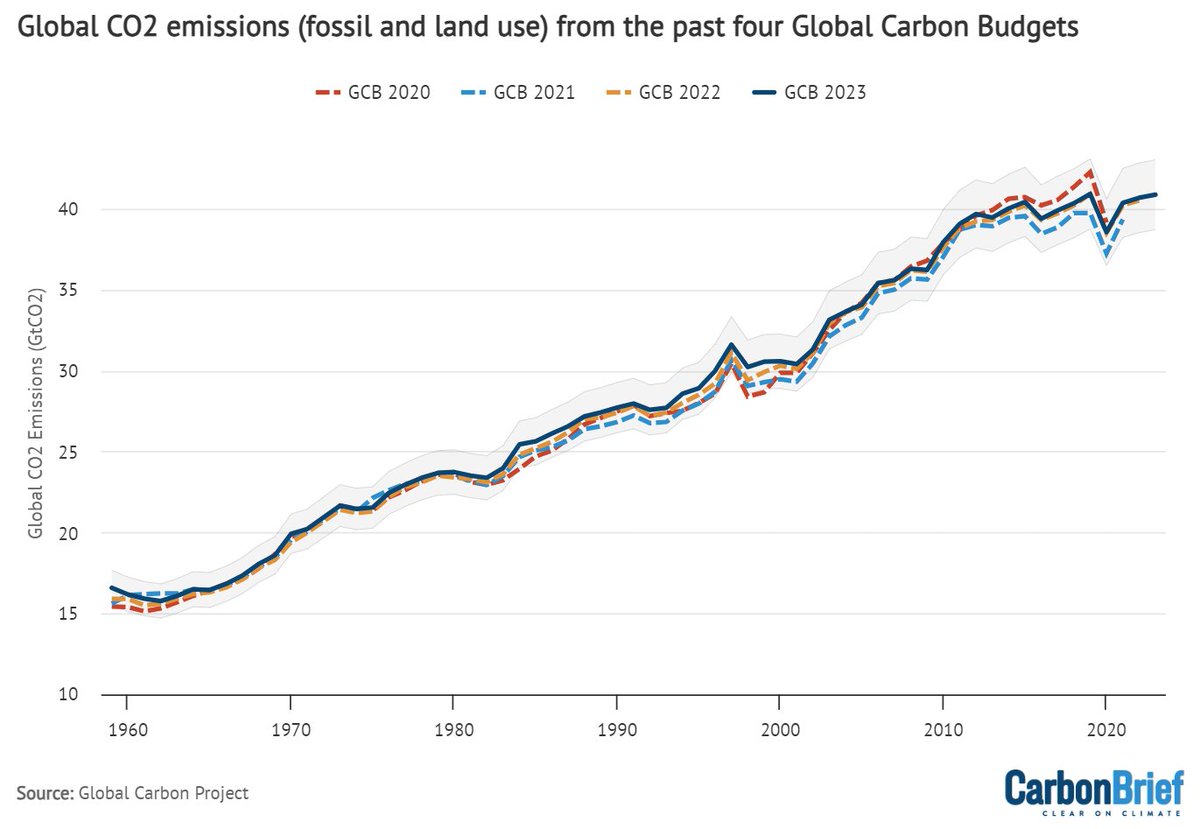
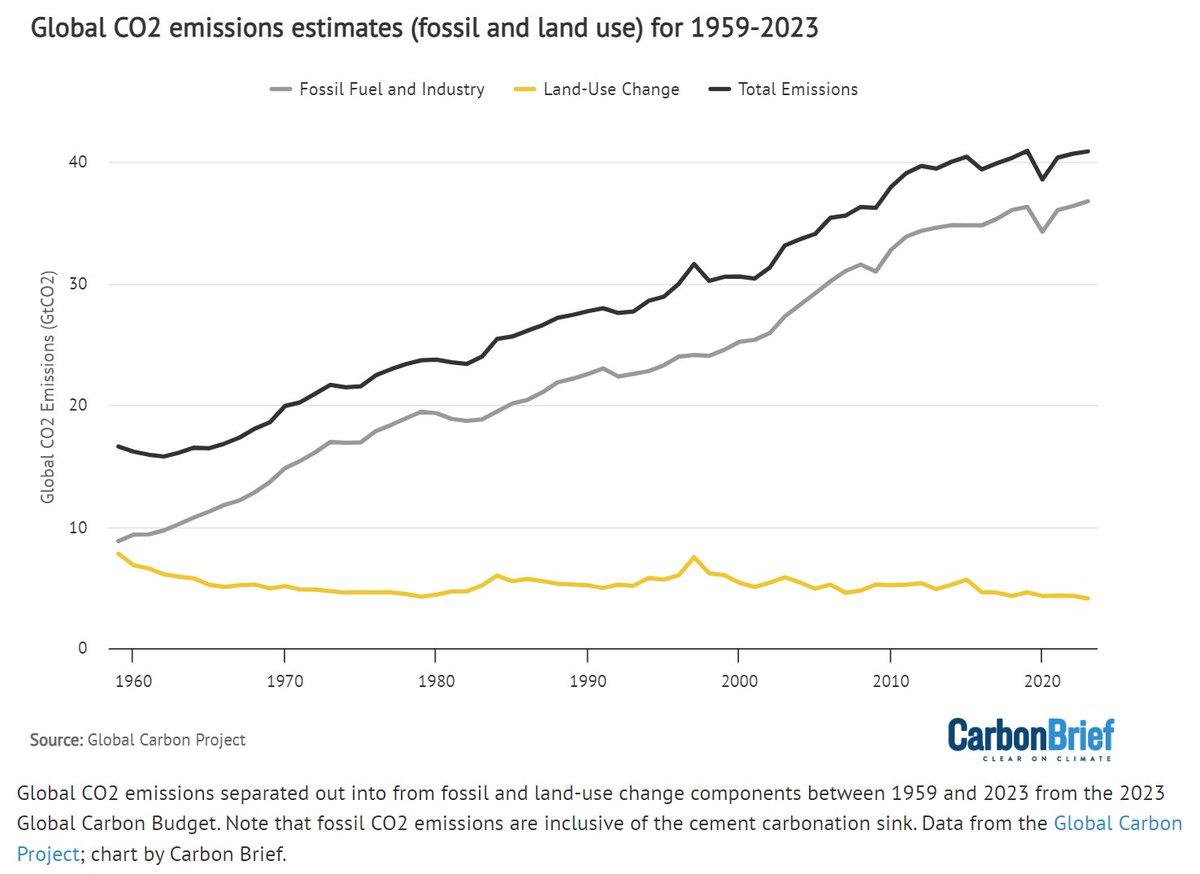
The second visual shows how observed warming is driven by emissions from human activities.

It shows that greenhouse gases alone would already have warmed the planet by 1.5°C, but air pollution is currently cooling it. Both need to be tackled.
(4/n)
Climate change is already affecting us our activities contribute to many observed changes in weather and climate extremes.
Each red hexagon represents a world region in which observed hot extremes have increased, with the number of dots representing our confidence.
(6/n)
This visual was actually too large to fully fit in a single tweet. Here is the same visual for heavy precipitation and droughts.

We see it's happening and we know it's us.
(7/n)
Combined again in a single visualisation (8/n)
The fourth visual shows scenarios that help @IPCC_CH describe the implications of our emission reduction choices.

They cover a full range from very high emissions that require a roll-back of climate policies to very low emissions that require deep cuts in the next decade. (9/n)
The final visual for today shows that every increment of warming matters for climate impacts.

That is true for temperatures. (10/n)
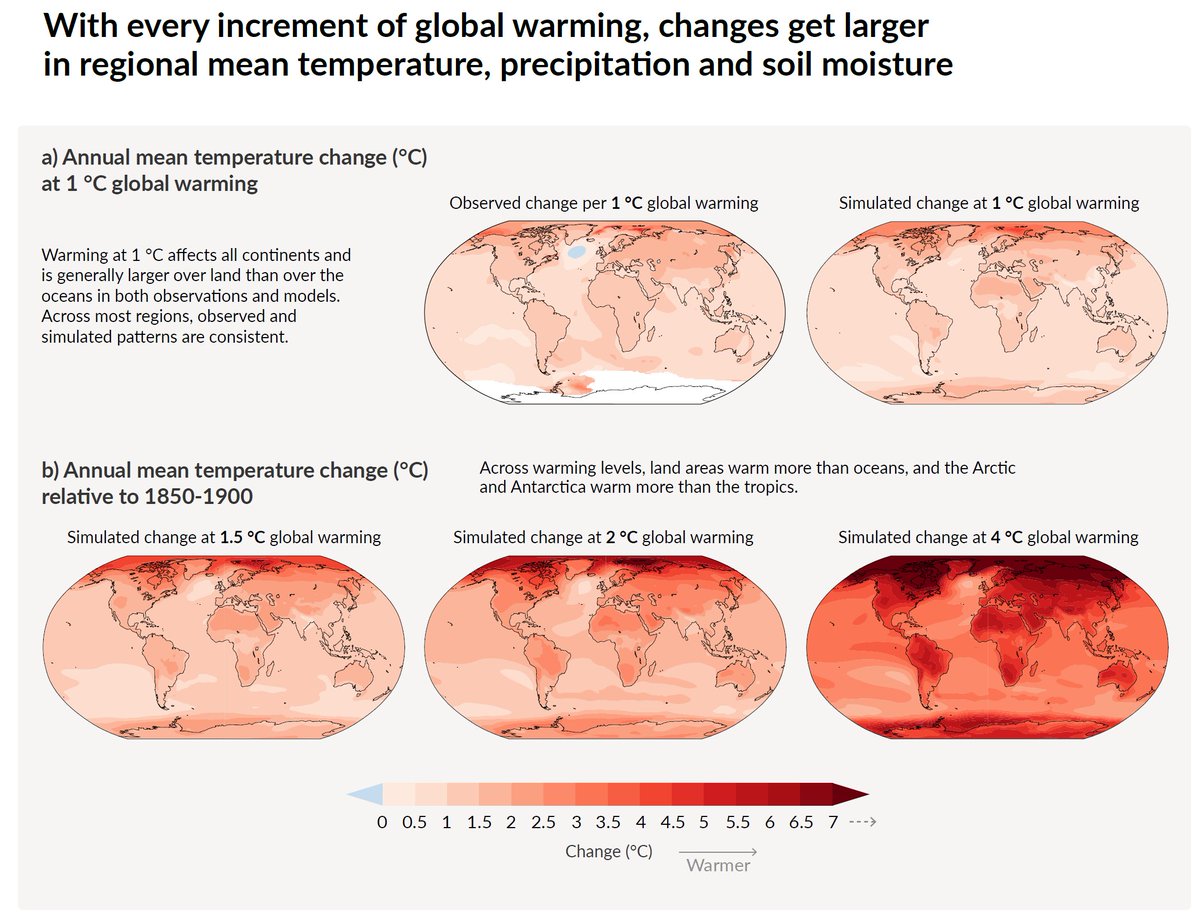
As well as for precipitation and soil moisture - important for the impact heatwaves have on society and crops.
(11/n)
Enough for today. Stay tuned for the second part of visual over the next days. (end)

• • •

Missing some Tweet in this thread? You can try to force a refresh
 

Keep Current with Joeri Rogelj

Joeri Rogelj Profile picture

Stay in touch and get notified when new unrolls are available from this author!

Read all threads

This Thread may be Removed Anytime!

PDF

Twitter may remove this content at anytime! Save it as PDF for later use!

Try unrolling a thread yourself!

how to unroll video
  1. Follow @ThreadReaderApp to mention us!

  2. From a Twitter thread mention us with a keyword "unroll"
@threadreaderapp unroll

Practice here first or read more on our help page!

More from @JoeriRogelj

Dec 5, 2023
Breaking news on #CO2 📢🔥🌍
The new @gcarbonproject emissions numbers are out with an analysis by @CarbonBrief

What do the numbers tell us?
Spoiler alert: they are quite the party pooper for prospects of global peaking 🥳💩😢 (1)
Global CO2 emissions from fossil fuels and the production of cement increased yet another 1.1% since 2022, reaching their highest level yet.
36.8 billion tons of CO2 in 2023!

Total CO2 emissions that include land use increased by ca. 0.5%, a tie with the 2019 record (2) Image
Any positive news here?
Land-use CO2 emissions have been declining slightly, but not at a pace that would be consistent with pathways meeting the Paris Agreement 1.5C ambition.
And their estimates are still accompanied by large scientific uncertainty. (3) Image
Read 8 tweets
Dec 4, 2023
Two quotes by two scientists have caused a bit of confusion. 👇

I am one of them.
So let me explain what I'm referring to here. (1) @KarlMathiesen
The latest @IPCC_CH mitigation report shows different ways in which warming can be kept to (close to) 1.5°C.
See the light-blue range in the figure below which shows global GHG emissions. (2) Image
Emissions also decline for carbon dioxide (CO2) and methane (CH4) individually, but to different levels. Only CO2 reaches net zero and goes net negative. (3)
Image
Image
Read 18 tweets
Nov 14, 2023
Hot off the press - new climate research 🚨🌍🔥
Will warming stop once we reach net zero CO2 emissions?

Open-access publication @FrontiersIn assessing what we know and don't know about whether warming will stop once net zero CO2 emissions are reached. /1
frontiersin.org/journals/scien…
With #NetZero targets established as key components of international and national climate policy, it becomes ever more pertinent to closely understand what reaching net-zero emissions will deliver and what it doesn't. /2

iopscience.iop.org/article/10.108…
That's why we, with an international team of scientists, take a deep look at the 'zero emissions commitment' or ZEC. In other words, how much warming (or cooling) can be expected once global emissions are brought down to zero.

For various reasons, we focus our effort on CO2. /3
Read 18 tweets
Jun 14, 2023
Today, the @esabcc_eu published its advice for the @EU_Commission's #2040ClimateTarget proposal and accompanying #GreenhouseGasEmissionsBudget

Interested in how the advice was developed?
Here’s a slightly longer explainer of the underlying report

🧵

climate-advisory-board.europa.eu/reports-and-pu…
1/n
The Advisory Board recommends the EU to take up a 2040 emissions reduction target of 90–95% compared to 1990 to keep the EU’s GHG budget to within 11 to 14 Gt CO2e between 2030 and 2050. #2040ClimateTarget #GreenhouseGasEmissionsBudget

Where do these numbers come from?

2/n
To arrive at this #2040ClimateTarget advice, the @esabcc_eu implemented its earlier recommendation to the @EU_Commission to follow an approach that is systematic, transparent and guided by EU values, when preparing its EU 2040 climate target proposal. 4/n
Read 23 tweets
Jun 14, 2023
In 2021, the European Climate Law created the European Scientific Advisory Board on Climate Change @esabcc_eu and tasked it to inform the EU’s #2040ClimateTarget and 2030-2050 greenhouse gas (GHG) budget.

Today, @esabcc_eu published its advice.
Here’s the short version 🧵1/n Image
The Advisory Board recommends the @EU_Commission to take up:

a 2040 emissions reduction target of 90–95% compared to 1990

to keep the EU’s GHG budget to within 11 to 14 Gt CO2e between 2030 and 2050.
2/n
This advice is based on an assessment of what would be both a fair and a feasible emissions reduction contribution of the EU to the global challenge of keeping warming to 1.5°C. 3/n
Read 7 tweets
Oct 27, 2022
Where are global emissions heading and where should they be going to keep #globalwarming well below 2C and 1.5C?

Today, @UNEP released the 2022 #emissionsgap report.

A look at the key messages

but caution, not much good news ahead 🧵/1
Countries’ new and updated pledges (NDCs) submitted since COP26 reduce projected global GHG emissions in 2030 by only 0.5 gigatons of CO2 equivalent (GtCO2e) compared with projections based on pledges at the time of COP26.
Some pledges result in even higher emissions /2
Countries are off track to achieve even the globally highly insufficient NDCs. Global GHG emissions in 2030 based on current policies are estimated at 58 GtCO2e. The implementation gap in 2030 between policies and NDCs is about 3 to 6 GtCO2e. /3
Read 24 tweets

Did Thread Reader help you today?

Support us! We are indie developers!


This site is made by just two indie developers on a laptop doing marketing, support and development! Read more about the story.

Become a Premium Member ($3/month or $30/year) and get exclusive features!

Become Premium

Don't want to be a Premium member but still want to support us?

Make a small donation by buying us coffee ($5) or help with server cost ($10)

Donate via Paypal

Or Donate anonymously using crypto!

Ethereum

0xfe58350B80634f60Fa6Dc149a72b4DFbc17D341E copy

Bitcoin

3ATGMxNzCUFzxpMCHL5sWSt4DVtS8UqXpi copy

Thank you for your support!

Follow Us!

:(