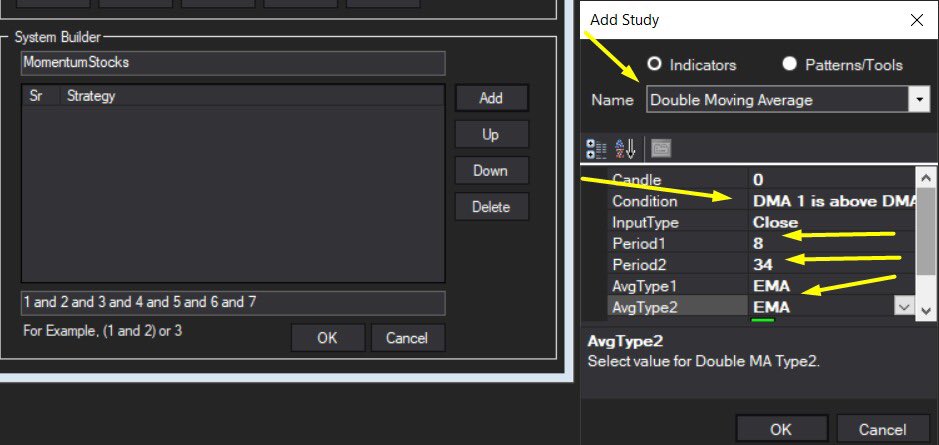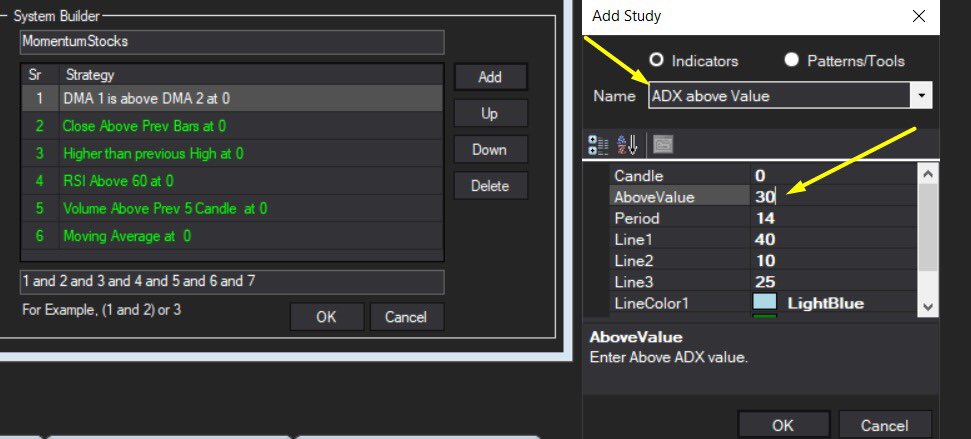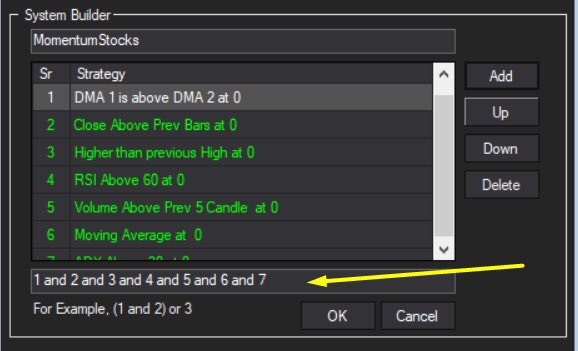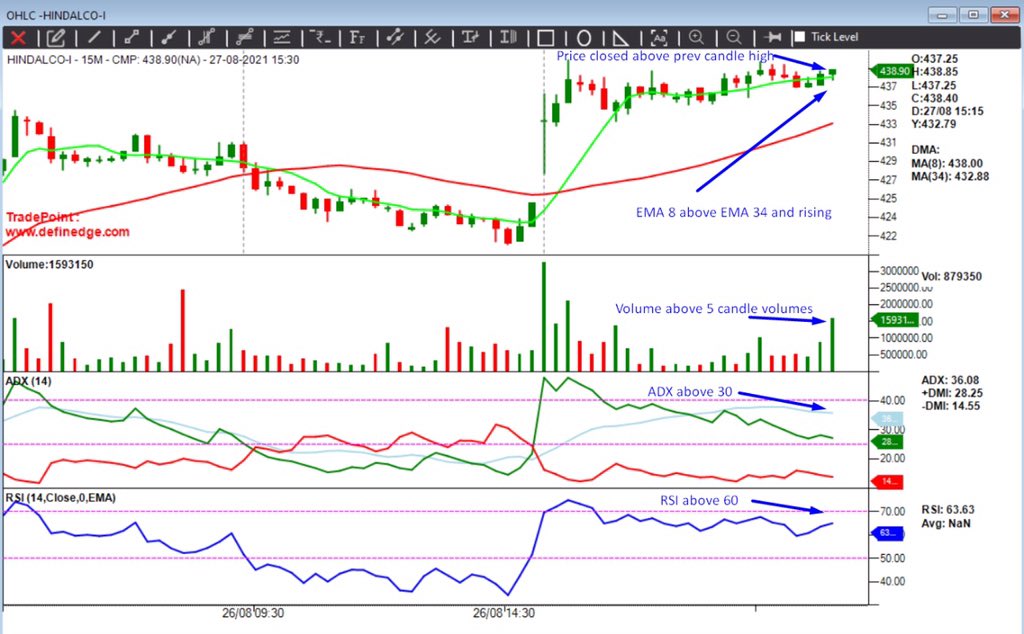
The thread explains my momentum scanner and how to build it in #TradePoint software.
@Definedge
Conditions :
1)EMA 8 above EMA 34 and rising
2)Candle close above previous 5 candle high
3) RSI above 60
4) Volume above previous 5 candles
5) ADX above 30
1/n
@Definedge
Conditions :
1)EMA 8 above EMA 34 and rising
2)Candle close above previous 5 candle high
3) RSI above 60
4) Volume above previous 5 candles
5) ADX above 30
1/n
Let us run it on real-time scanner on 15 min time frame (since market is closed now it will show with reference to the last candle in 15min) we get the following stocks
12/n
12/n

This scanner will indicate momentum stocks and for entry exit etc I use P&F charts and trade intra day. While running the scanner we can specify the TF (like daily/weekly etc) in EOD scanner. Useful to run it on weekly or monthly for investment purposes.
14/14
14/14
• • •
Missing some Tweet in this thread? You can try to
force a refresh


