1/ $ZM Thread - Slides from Investors Relations:

Closed at $347.50 but down 10% AH.

Guidance was flat - Wall Street likes to see it higher.

Q3 Rev: $1,015 - $1,020 million vs $1.0173B estimate

Full Year Rev: $4,005 - $4,015 million vs $4.012B estimate

#holdingshares
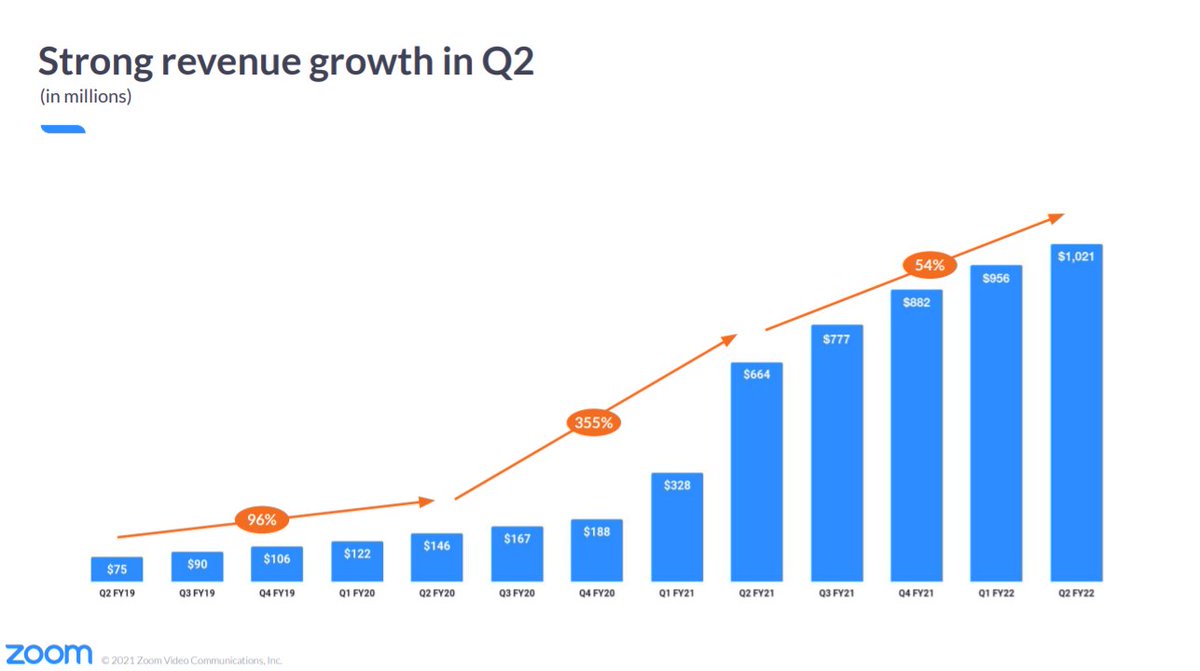
2/ $ZM Revenue Growth in Q2

$1 Billion is quarterly revenue but growth slowing - as expected, post COVID lockdowns.
3/ $ZM FY22 Expenses & Margins
4/ $ZM Growing International Presence
5/ $ZM Expanding Customer Base

• • •

Missing some Tweet in this thread? You can try to force a refresh
 

Keep Current with Chris Perruna

Chris Perruna Profile picture

Stay in touch and get notified when new unrolls are available from this author!

Read all threads

This Thread may be Removed Anytime!

PDF

Twitter may remove this content at anytime! Save it as PDF for later use!

Try unrolling a thread yourself!

how to unroll video
  1. Follow @ThreadReaderApp to mention us!

  2. From a Twitter thread mention us with a keyword "unroll"
@threadreaderapp unroll

Practice here first or read more on our help page!

More from @cperruna

8 Sep
1/ $PATH - $62.46, down 7.5% after hours but the report looks good.

Slides in thread:
1. Overall glance
2. ARR
3. Revenue
4. Profitability
5. Guidance

#HoldingShares
2/ $PATH ARR
3/ $PATH Revenue
Read 5 tweets
17 Aug
THREAD

Buy What the Funds are Buying!

The sweet spot is the number of funds accumulating, rising from 200 to 1,000+ funds.

This is where the big runs happen (and beyond)!

Institutions move stocks long term.

10 EXAMPLES:

$SE
$SHOP
$ETSY
$NET
$TTD
$CRWD
$ZM
$PTON
$DOCU
$SNAP
2/ $SE

From 272 to 1,586 funds

+859% Image
3/ $SHOP

From 1,035 to 2,008 funds

+284% Image
Read 11 tweets
16 Aug
THREAD

Can major market tops & bottoms be identified with accuracy? Yes!

Data is presented showing that identifying “major” market bottoms is easier than any other change in market direction. Market tops can also be identified but a bit more difficult.

chrisperruna.com/2013/03/18/ide…
2/ Daily New Low readings were well above 1,000 with a peak of 2,901 on Friday, 10/10/08. The market was screaming exhaustion as the selling pressure of the past 18 months was hitting its max. All other readings were in extreme territory including the basic NH-NL differential...
3/ the 10d & 30d differentials and the % ratio. The extreme readings continued through the end of November 2008 when they final subsided in December but remained negative.
Read 10 tweets
16 Aug
The % of stocks on the Nasdaq trading above their 200d ma sinks to the lowest level since coming out of the COVID collapse last April & May.

The divergence continues with index near highs and breadth sinking lower, 39.97%

My July breadth updates linked below in thread.

$COMP
Read 4 tweets
10 Jul
12 Notable Leaders Near 200d ma

All growing sales by at least 30% QoQ
Most with positive EPS QoQ

$APPS
$CHGG
$CHWY
$ETSY
$MELI
$NOW
$OKTA
$PTON
$SNOW
$TSLA
$TTD
$ZM
$APPS - $64.29
$CHGG - $85.24
Read 14 tweets
1 Jul
Growth Account | June 2021 Holdings:
+11.19% in June
+9.42% YTD

$PLTR: 7.9% of portfolio
$TDOC: 7.1%
$NET: 6.8%
$SE: 5.9%
$CRWD: 5.4%
$SQ: 5.2%
$ROKU: 4.9%
$U: 4.7%
$DDOG: 4.5%
$ZM: 4.1%
$CMLF: 3.6%
$PINS: 3.4%
$APPS: 3.3%
$MRVI: 2.7%
$FSLY: 2.5%
$IPOE: 2.0% (Calls)

Cash: 26.0%
2) Con't:

Cash by (end of) month 2021:
Jan: 5.2%
Feb: 9.1%
Mar: 41.7%
April: 30.9%
May: 35.6%
June: 26.0%
3) Account YTD, at end of month:

January 31st: +8.35%
February 28th: +5.92%
March 31st: -2.81%
April 30th: -3.02%
May 31st: -1.59%
June 30th: +9.42%

YTD Account high: 2/09/21
YTD Account low: 5/13/21
Read 4 tweets

Did Thread Reader help you today?

Support us! We are indie developers!


This site is made by just two indie developers on a laptop doing marketing, support and development! Read more about the story.

Become a Premium Member ($3/month or $30/year) and get exclusive features!

Become Premium

Too expensive? Make a small donation by buying us coffee ($5) or help with server cost ($10)

Donate via Paypal Become our Patreon

Thank you for your support!

Follow Us on Twitter!

:(