
9/7 Texas C19 Pos%, Case, Hosp & Fatality Update:
THREAD:
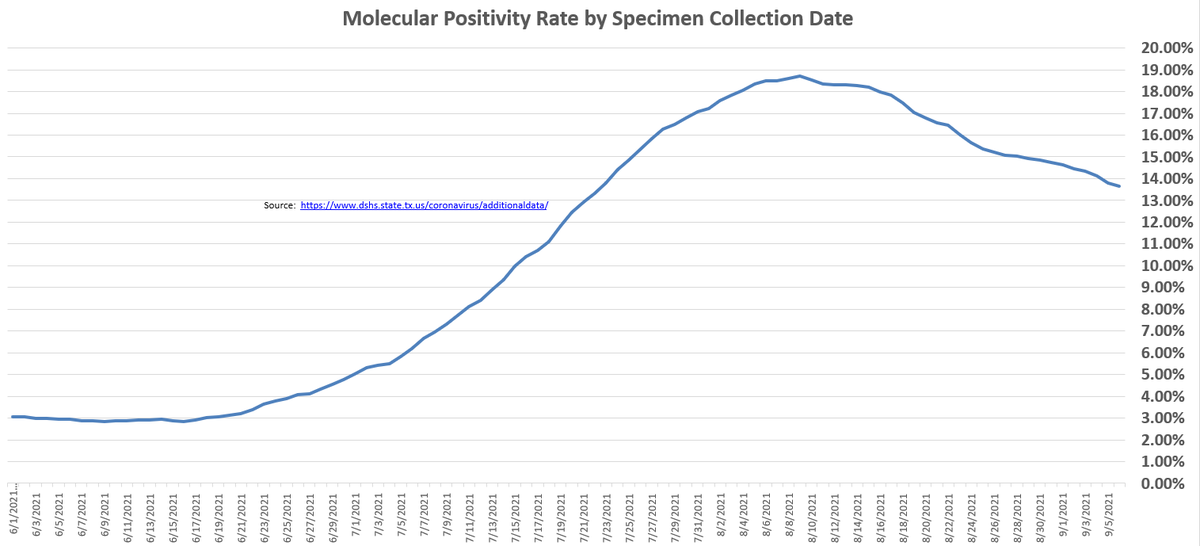
1) PCR Pos% rate at 13.64%
2) Cases plummet - Labor Day (LD)
3) Hospitalizations decline. Some LD but trends are lower - period
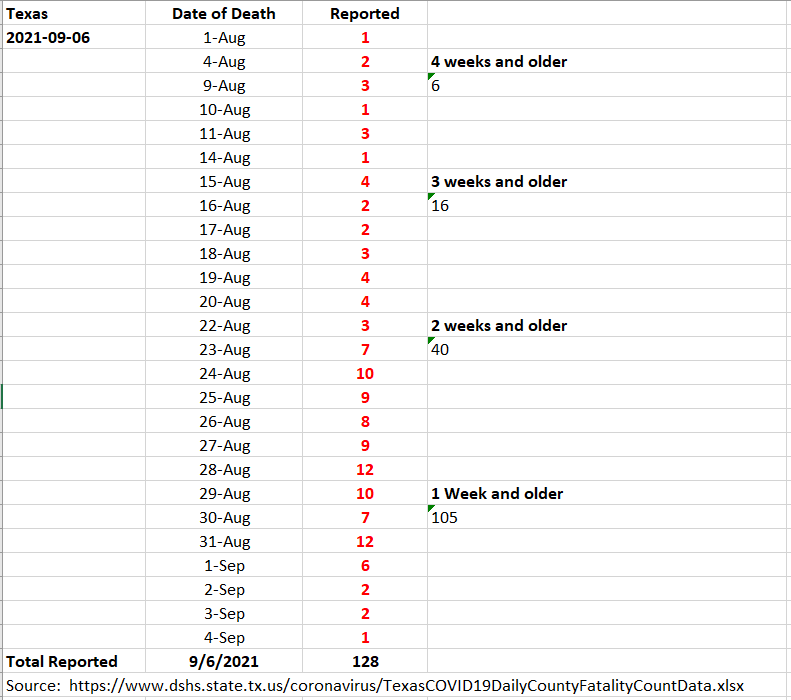
3) Fatality breakdown on 128 fatalities - LD. Prepare for big #s rest of week
1/n
.
THREAD:
1) PCR Pos% rate at 13.64%
2) Cases plummet - Labor Day (LD)
3) Hospitalizations decline. Some LD but trends are lower - period
3) Fatality breakdown on 128 fatalities - LD. Prepare for big #s rest of week
1/n
.
https://twitter.com/therealarod1984/status/1434993858346209284
9/7 Indicators
* PCR Pos% at 13.64. Looks great
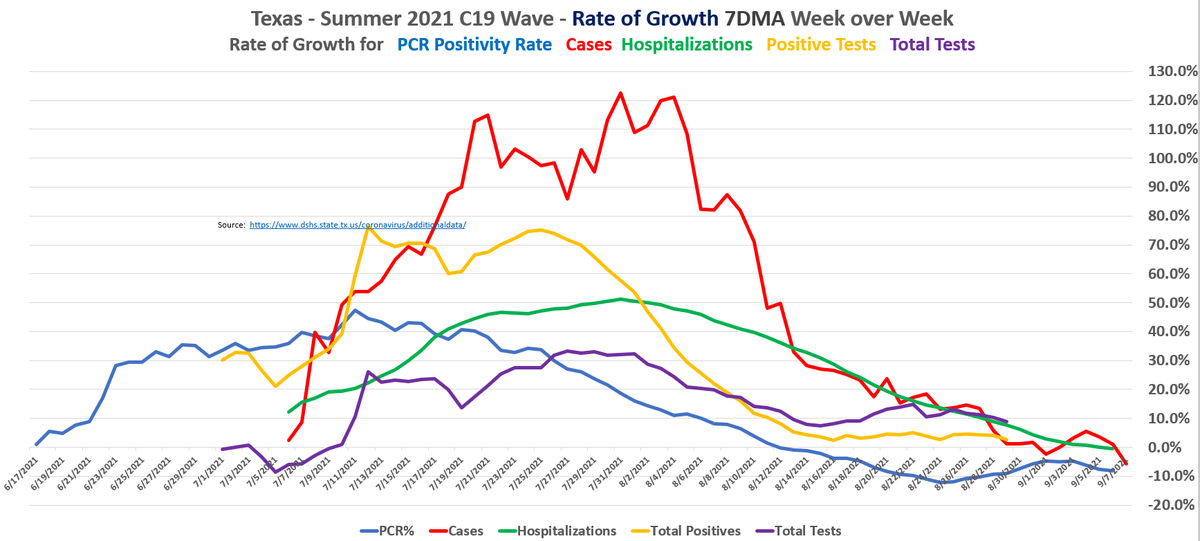
* 14DMA Case Rate of Decline at 5.6%
* Hospitalizations Rate of Decline at 0.5%
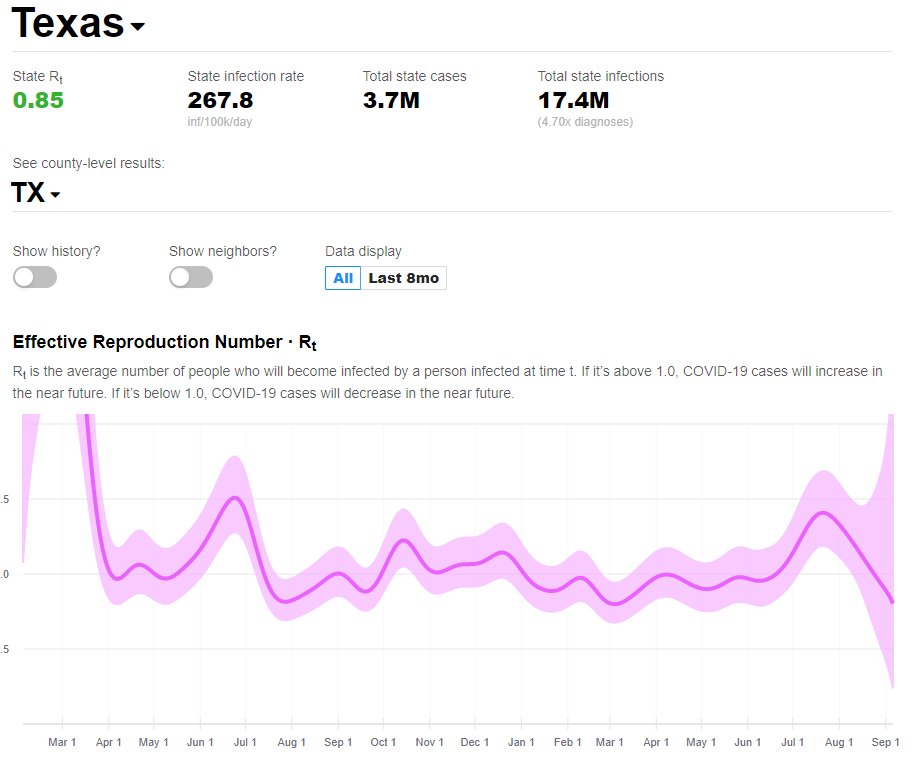
* Rt at 0.85
* No testing update today, see tweet from earlier today
* Its ovah, even with Labor Day
2/n
.
* PCR Pos% at 13.64. Looks great
* 14DMA Case Rate of Decline at 5.6%
* Hospitalizations Rate of Decline at 0.5%
* Rt at 0.85
* No testing update today, see tweet from earlier today
* Its ovah, even with Labor Day
2/n
.
9/7 Cases
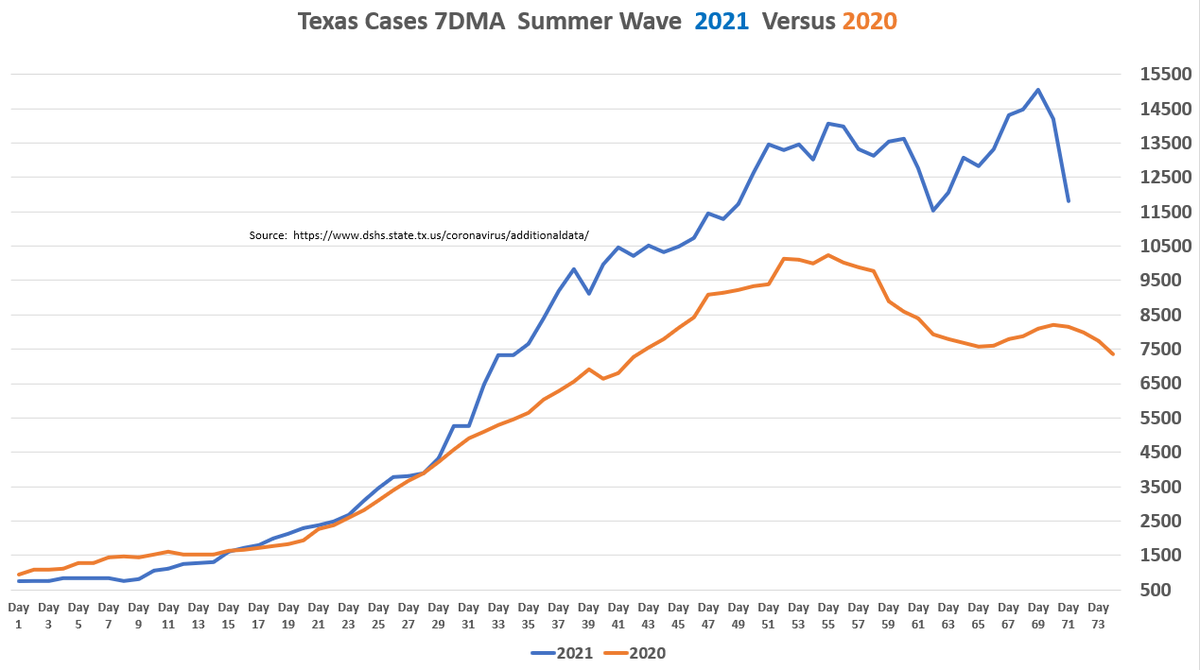
* 6.0K Cases vs 22.7K last Tues
* Case 7DMA WoW declines 10%
* Peak is 9/5
* Labor Day reporting. Tomorrow should be a big number of cases reported. Will be watching to see if 7DMA can recover from this far a drop to set new peak. Its a tough week of comps
3/n
.
* 6.0K Cases vs 22.7K last Tues
* Case 7DMA WoW declines 10%
* Peak is 9/5
* Labor Day reporting. Tomorrow should be a big number of cases reported. Will be watching to see if 7DMA can recover from this far a drop to set new peak. Its a tough week of comps
3/n
.
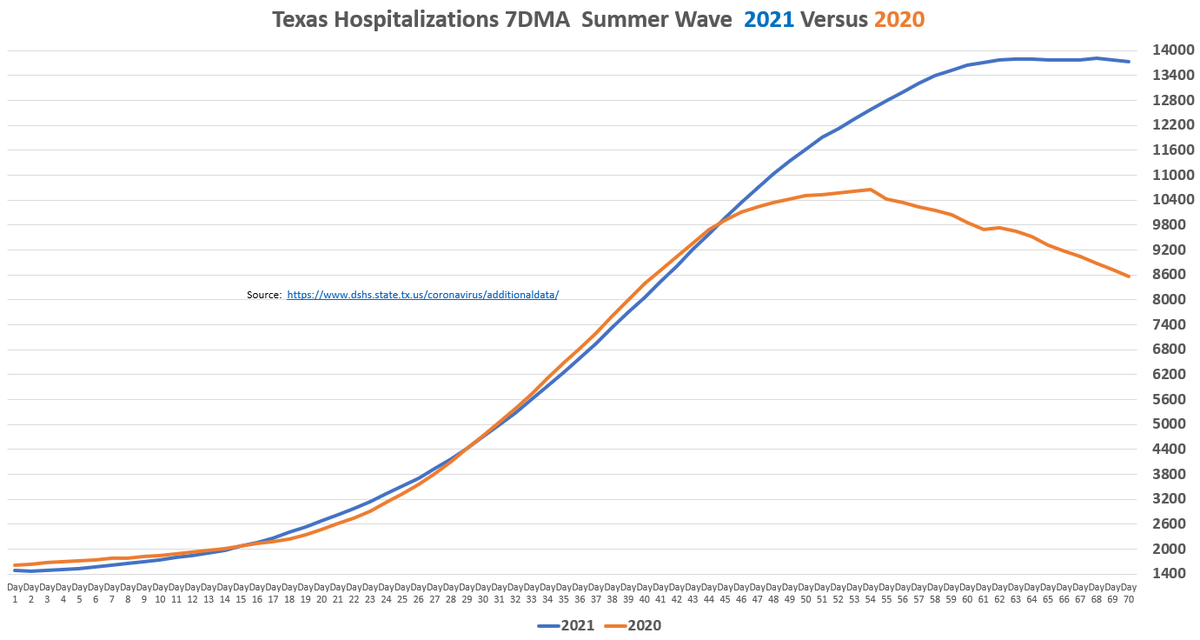
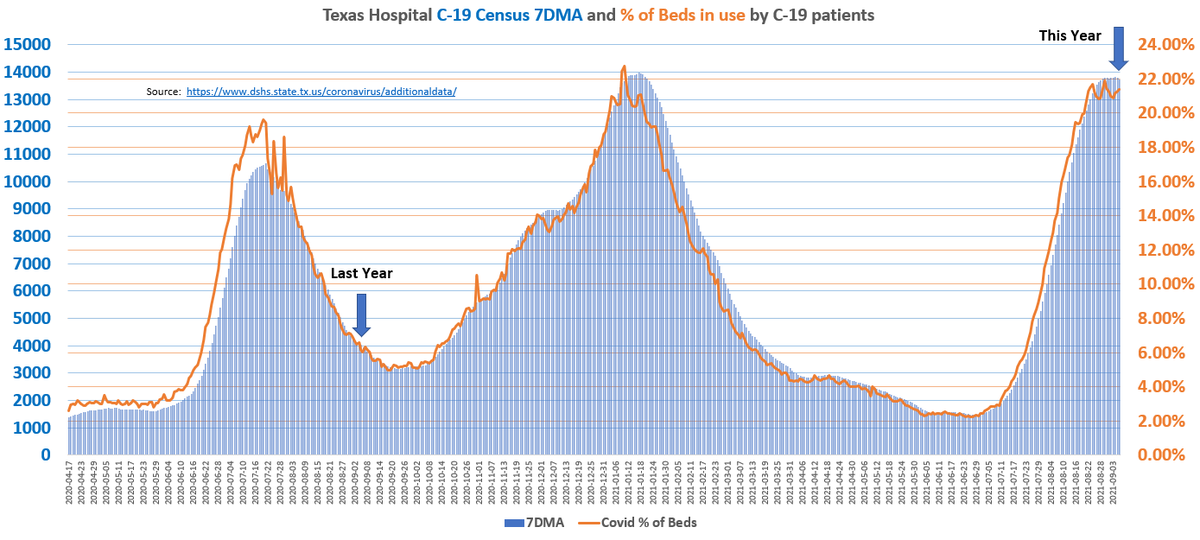
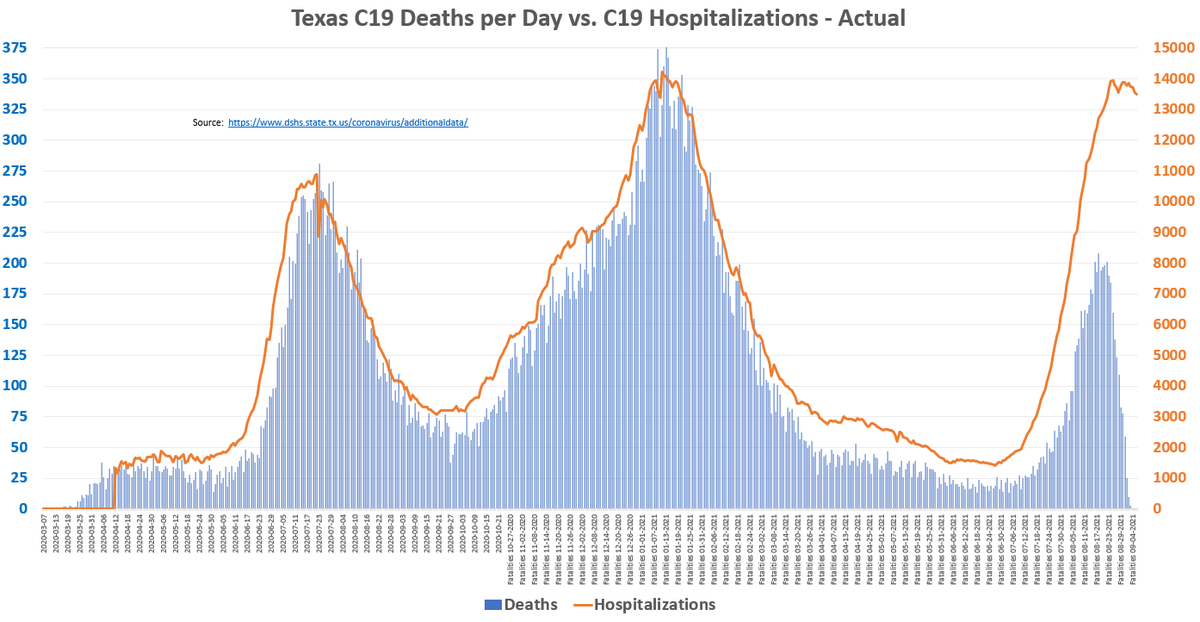
9/7 Hospitalizations
* -46 to 13499. Last Tues was +210
* Single Day Peak is 8/25 - 13932
* 7DMA RoG at 0.5%
* Likely some Labor Day baked in here, but the trends were down well before. I think 8/25 holds as high
* Never went higher than 22% of beds used for C19
4/n
.
* -46 to 13499. Last Tues was +210
* Single Day Peak is 8/25 - 13932
* 7DMA RoG at 0.5%
* Likely some Labor Day baked in here, but the trends were down well before. I think 8/25 holds as high
* Never went higher than 22% of beds used for C19
4/n
.
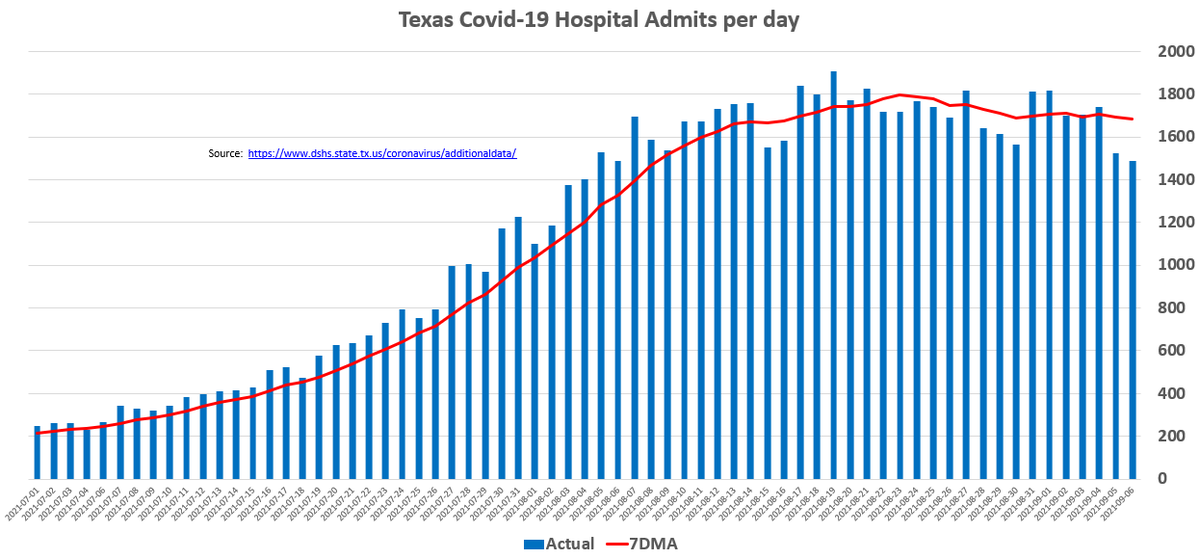
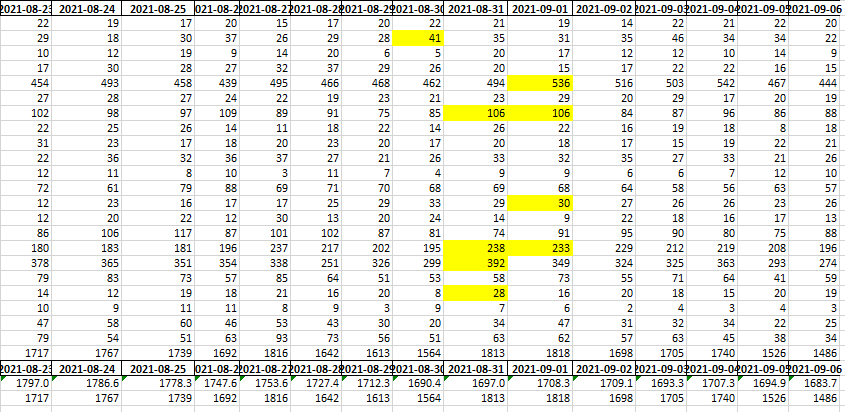
9/7 - Hosp Covid Admits
Another good day across the board. Hospital Admits are dropping strongly. We will watch for tomorrow and Thursday to see if this recovers as part of Labor Day or not. They've been dropping for 2 weeks so likely not a whole lot of rebound
5/n
.
Another good day across the board. Hospital Admits are dropping strongly. We will watch for tomorrow and Thursday to see if this recovers as part of Labor Day or not. They've been dropping for 2 weeks so likely not a whole lot of rebound
5/n
.
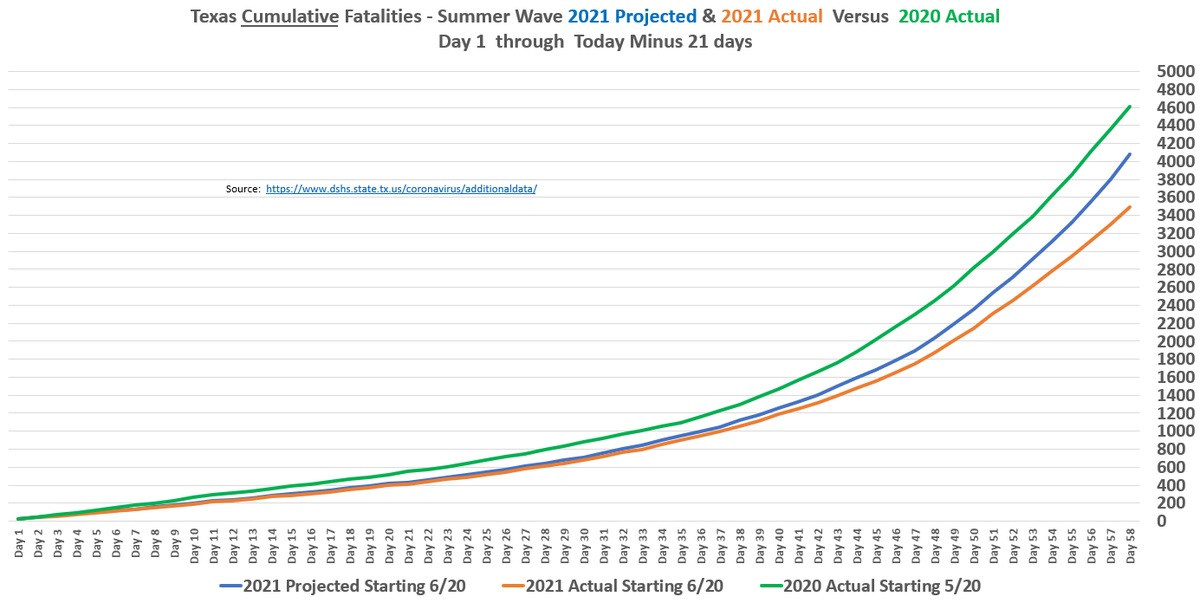
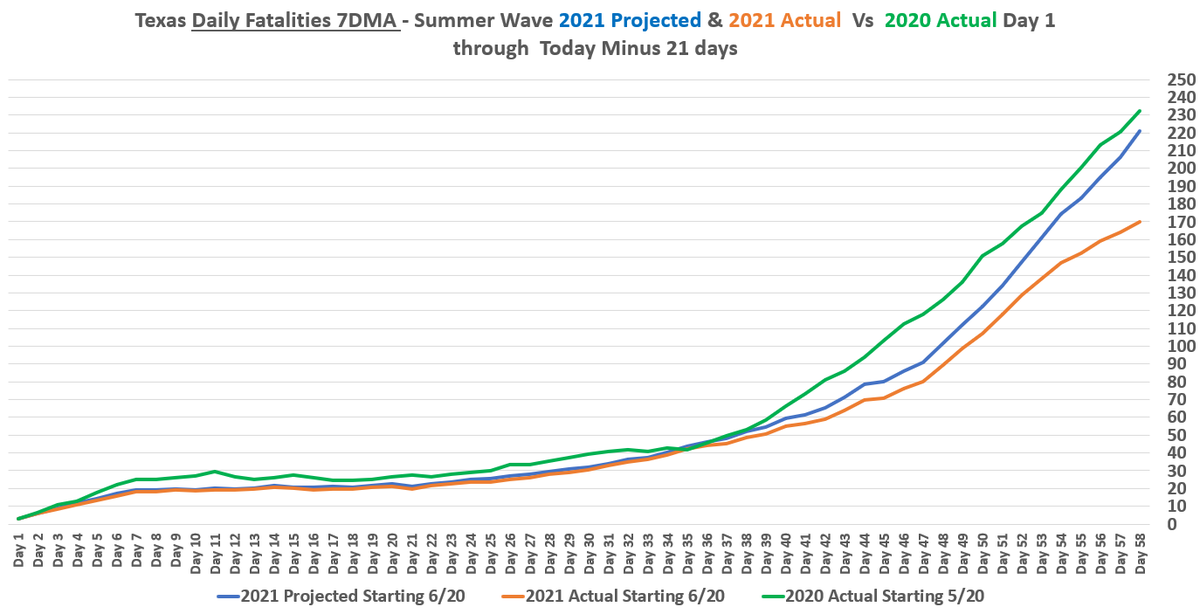
9/7 Fatalities Part 1 of 2:
* Primer in 8/n
* 2021 thru 8/16, 2020 thru 7/16, waves 13 months apart
* Fatalities thru these dates:
* 2020- 4613, 232 7DMA
* 2021- 3497, 170 7DMA
* Because Hosps peaked much higher than Summer 2020, we start looking at Winter 2020
6/n
.
* Primer in 8/n
* 2021 thru 8/16, 2020 thru 7/16, waves 13 months apart
* Fatalities thru these dates:
* 2020- 4613, 232 7DMA
* 2021- 3497, 170 7DMA
* Because Hosps peaked much higher than Summer 2020, we start looking at Winter 2020
6/n
.
9/7 Fatalities Part 1 of 2:
* 128 Reported. -103 vs LW. Labor Day
* Going to be 4 rough days of reporting this week, starting tomorrow. Get ready. In the 300-375 per day range
* Will actual Fatalities reach 375 a day like Winter 2020? Doesn't appear.
7/n
.
* 128 Reported. -103 vs LW. Labor Day
* Going to be 4 rough days of reporting this week, starting tomorrow. Get ready. In the 300-375 per day range
* Will actual Fatalities reach 375 a day like Winter 2020? Doesn't appear.
7/n
.
9/7 Conclusion
* All the indicators say this is over
* Cases & Fatalities should rebound from Labor Day tomorrow. We will see if same holds for Hosps
* This summer wave continues to be 25% less lethal than last thru Day 58. CFR difference will be well north of 25%
9/end
* All the indicators say this is over
* Cases & Fatalities should rebound from Labor Day tomorrow. We will see if same holds for Hosps
* This summer wave continues to be 25% less lethal than last thru Day 58. CFR difference will be well north of 25%
9/end
• • •
Missing some Tweet in this thread? You can try to
force a refresh


