
9/8 Texas C19 Pos%, Case, Hosp & Fatality Update:
THREAD:
1) Testing peaking last week?
2) Big Case catch up day, but new peak maybe not in reach?
3) Hospitalizations down vs last week (LW), even post Labor Day
4) Fatality breakdown on 286 reported. Down again from LW?
1/n
.
THREAD:
1) Testing peaking last week?
2) Big Case catch up day, but new peak maybe not in reach?
3) Hospitalizations down vs last week (LW), even post Labor Day
4) Fatality breakdown on 286 reported. Down again from LW?
1/n
.
https://twitter.com/therealarod1984/status/1435297068734615553
9/8 Indicators
* PCR Pos% as of 8/31 at 13.81%
* Testing through 8/31 appears to be forming a peak. 7DMA rate of increase is nearing zero
* Covidestim with huge drop in Rt to .76
* If Tests are cresting w/ declining positivity, this week will see declines in cases
2/n
.
* PCR Pos% as of 8/31 at 13.81%
* Testing through 8/31 appears to be forming a peak. 7DMA rate of increase is nearing zero
* Covidestim with huge drop in Rt to .76
* If Tests are cresting w/ declining positivity, this week will see declines in cases
2/n
.


9/8 Cases
* 25.1K Cases reported, Labor Day catch up vs 17.0K last Wed
* Case 7DMA WoW up 1.2%
* Peak is 9/5
* 7DMA is over 2K behind peak. With 3 tough comps coming up, don't think there's enough cases left to set a new peak. Especially with tests cresting thru 8/31
3/n
.
* 25.1K Cases reported, Labor Day catch up vs 17.0K last Wed
* Case 7DMA WoW up 1.2%
* Peak is 9/5
* 7DMA is over 2K behind peak. With 3 tough comps coming up, don't think there's enough cases left to set a new peak. Especially with tests cresting thru 8/31
3/n
.


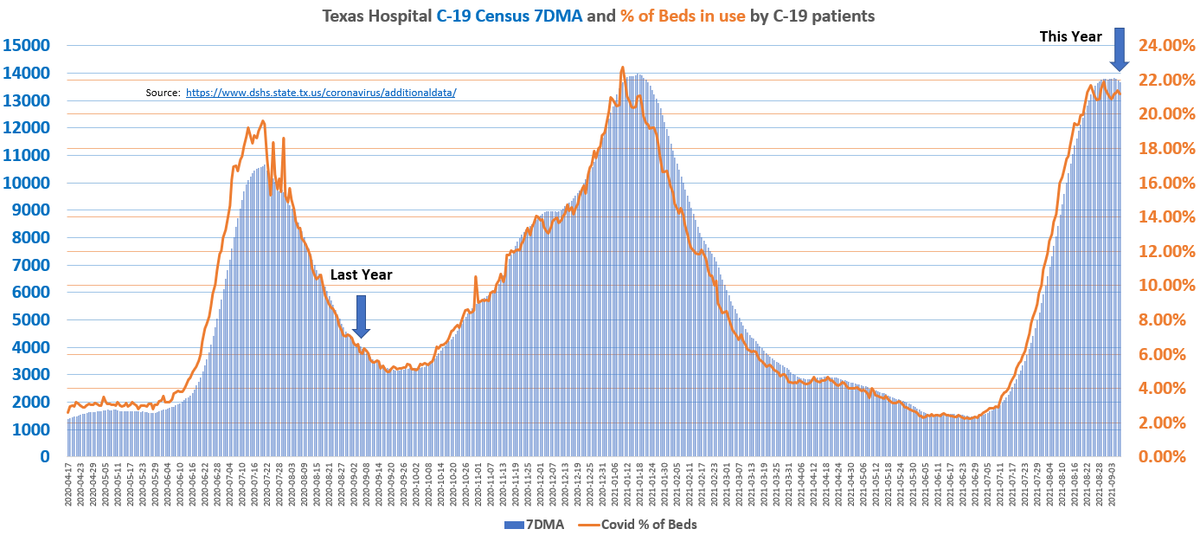
9/8 Hospitalizations
* +21 to 13520. Last Wed was +18
* Barely any post Labor Day rebound
* Single Day Peak is 8/25 - 13932
* 7DMA Rate of Decline at 0.9%
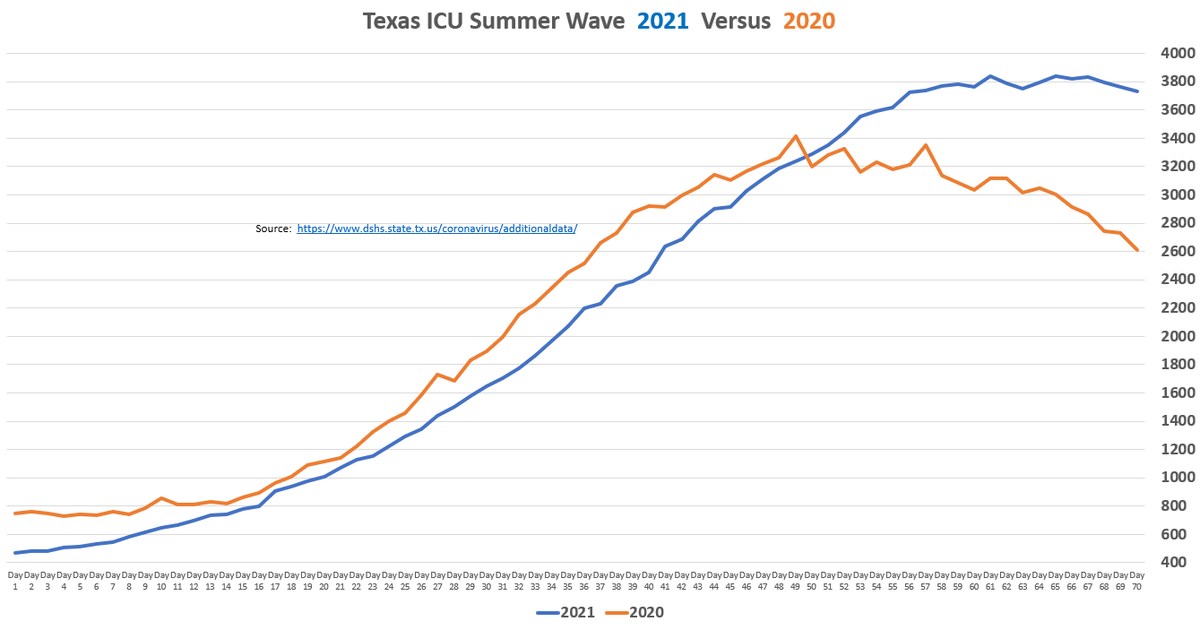
* ICU also post peak
* Based on 5/n Admits these numbers are only going down
4/n
.
* +21 to 13520. Last Wed was +18
* Barely any post Labor Day rebound
* Single Day Peak is 8/25 - 13932
* 7DMA Rate of Decline at 0.9%
* ICU also post peak
* Based on 5/n Admits these numbers are only going down
4/n
.


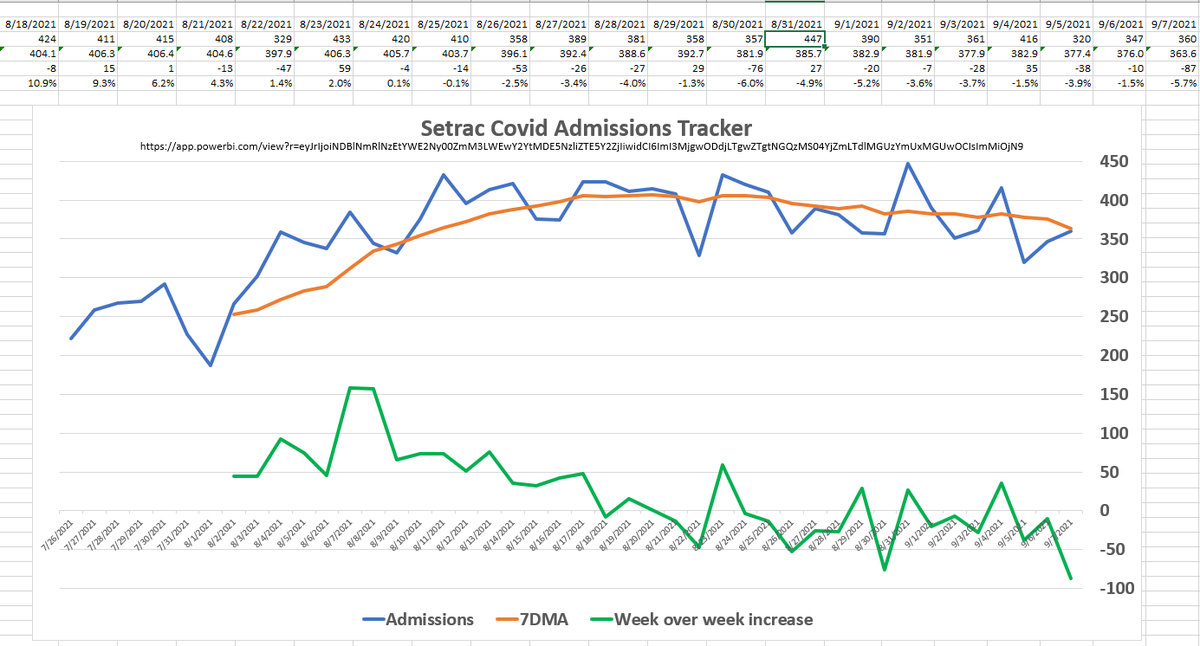
9/8 - Hosp Covid Admits
* Statewide Admits down 227 from last Wednesday
* Tomorrow should be last day for any post Labor Day rebound
* 14DMA rate of change for all TSA areas - majority are negative
* TMC and SETRAC reflect same trend down
Fatalities later
5/n
.
* Statewide Admits down 227 from last Wednesday
* Tomorrow should be last day for any post Labor Day rebound
* 14DMA rate of change for all TSA areas - majority are negative
* TMC and SETRAC reflect same trend down
Fatalities later
5/n
.


9/8 - Fatalities Part 1
Deep diving today. As hosps peaked last week of Aug, so will fatalities. Already seeing reporting numbers into that week.
1st off, this week's Cut 1 projections were virtually the same as last week's Cut 1. Either LaborDay or could be flattening.
6/n
.
Deep diving today. As hosps peaked last week of Aug, so will fatalities. Already seeing reporting numbers into that week.
1st off, this week's Cut 1 projections were virtually the same as last week's Cut 1. Either LaborDay or could be flattening.
6/n
.

9/8 - Fatalities Part 2
The projections estimate # of fatalities will be reported for a date. The estimator %s are at bottom of 6/n. Briefly:
Date 2 weeks old (wo) has 57% of fatalities in
3 wo = 79%
4 wo = 90%
Actuals have come in much faster than this for 60 days now
7/n
The projections estimate # of fatalities will be reported for a date. The estimator %s are at bottom of 6/n. Briefly:
Date 2 weeks old (wo) has 57% of fatalities in
3 wo = 79%
4 wo = 90%
Actuals have come in much faster than this for 60 days now
7/n
9/8 - Fatalities Part 3
Ultimately, I'm trying to estimate how the red circle fills in. Right now I'm comparing 2020 Summer to 2021 Summer, but as you can see, the peak of 2021 Summer hospitalizations was so much higher than Summer 2020. Almost identical to Winter 2020.
8/n
.
Ultimately, I'm trying to estimate how the red circle fills in. Right now I'm comparing 2020 Summer to 2021 Summer, but as you can see, the peak of 2021 Summer hospitalizations was so much higher than Summer 2020. Almost identical to Winter 2020.
8/n
.

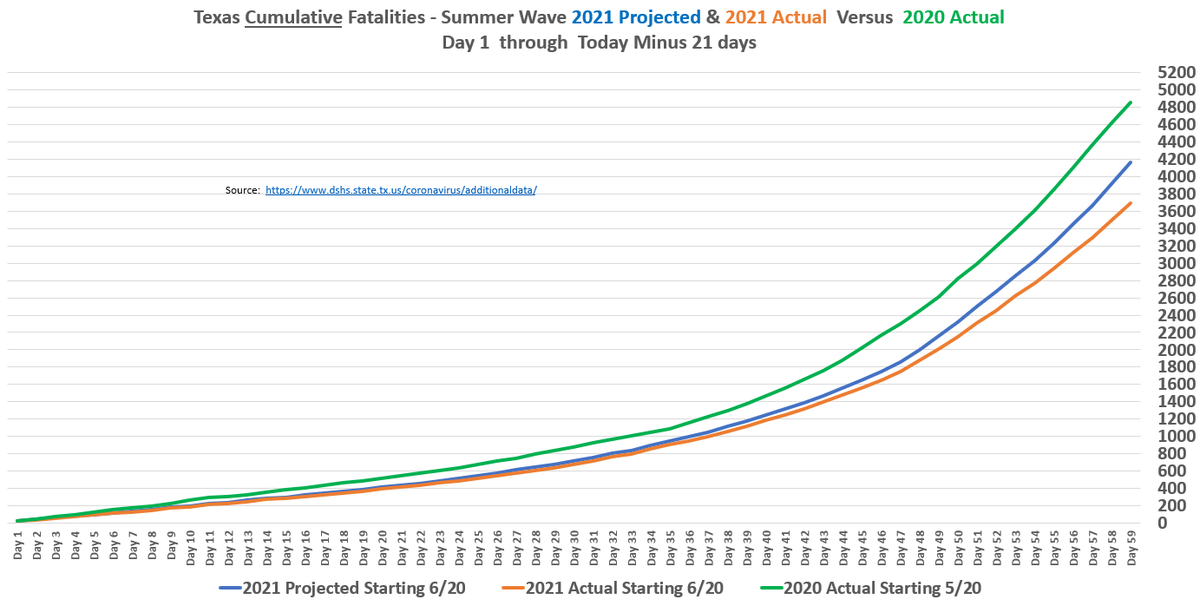
9/8 - Fatalities Part 4
In comparing to 2020 on the left, you can see #1 how much higher the hospitalization line rises. #2, you can see how much lower the fatalities are through 8/17/21 & 7/17/20 - 2 waves 13 months apart. 10/n will do the usual breakdown of that
9/n
In comparing to 2020 on the left, you can see #1 how much higher the hospitalization line rises. #2, you can see how much lower the fatalities are through 8/17/21 & 7/17/20 - 2 waves 13 months apart. 10/n will do the usual breakdown of that
9/n

9/7 Fatalities Part 5:
* Primer in 12/n
* 2021 thru 8/17, 2020 thru 7/17, waves 13 mo apart
* Fatalities thru above:
* 2020- 4855, 238 7DMA
* 2021- 3690, 176 7DMA
* Despite much higher hosps at this point in the wave, fatalities running 25% lower than 2020.
10/n
.
* Primer in 12/n
* 2021 thru 8/17, 2020 thru 7/17, waves 13 mo apart
* Fatalities thru above:
* 2020- 4855, 238 7DMA
* 2021- 3690, 176 7DMA
* Despite much higher hosps at this point in the wave, fatalities running 25% lower than 2020.
10/n
.

9/8 Fatalities Part 6
* 2 - 2020 Deaths in todays report #nuts
* You can see 95% of fatalities were less than 3 weeks old. First half of August getting virtually nothing now
* I expect some heavier reporting tomorrow due to Labor Day, but we are post peak now. Who knows
11/n
* 2 - 2020 Deaths in todays report #nuts
* You can see 95% of fatalities were less than 3 weeks old. First half of August getting virtually nothing now
* I expect some heavier reporting tomorrow due to Labor Day, but we are post peak now. Who knows
11/n


9/8 - Fatalities Primer
Original 7/20/20 primer. Again the projections are over-estimating total fatalities, because Im expecting more older ones than we've seen. 3 Cuts at estimates whittles down the gap. Also a final cut at 6 weeks (not shown)
12/n
Original 7/20/20 primer. Again the projections are over-estimating total fatalities, because Im expecting more older ones than we've seen. 3 Cuts at estimates whittles down the gap. Also a final cut at 6 weeks (not shown)
12/n
https://twitter.com/therealarod1984/status/1417550891842932737?s=20
9/8 - Conclusion
We are post peak, even cases almost assuredly. Testing seems to have been leveling out last week of Aug. Hospitalizations - its all downhill now. We've got 3 more rough days of fatality reports, and some into next week and then its going to cool off.
13/end
We are post peak, even cases almost assuredly. Testing seems to have been leveling out last week of Aug. Hospitalizations - its all downhill now. We've got 3 more rough days of fatality reports, and some into next week and then its going to cool off.
13/end
• • •
Missing some Tweet in this thread? You can try to
force a refresh


